Utilizing EvidenceBased Practices to Reduce Serious Injury and

Utilizing Evidence-Based Practices to Reduce Serious Injury and Fatality Crashes on Rural Roadways Captain Ken Clary Iowa State Patrol clary@dps. state. ia. us
 70% Percentage of fatalities that occur")
37, 461 Vehicle Crash Fatalities in 2016 (NHTSA) 70% Percentage of fatalities that occur on rural roadways (NHTSA) 4, 100, 000 Mile of rural roadway in the United States (USDOT)
 76% Percentage of")
370 Crash Fatalities Annually in Iowa / 10 year average (GTSB) 76% Percentage of fatalities that occur on rural roadways in Iowa (IDOT) 92, 000 Mile of rural roadway in the Iowa (IDOT)
 Koper Curve (Random and")
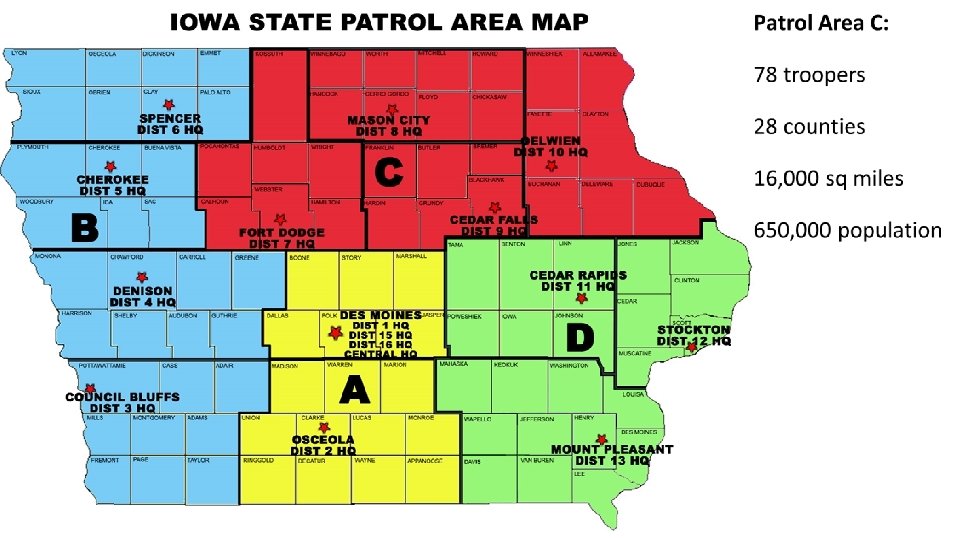
Hot spot policing (Place-Based / Directed Patrol on a ‘macro-scale’) Koper Curve (Random and Intermittent Hot Spot policing – Increasing the perception of LE presence) Community Policing (Proactive Deterrence Techniques Leaving a lasting/residual effect)

94% Serious injury and fatality crashes are the result of human behavior (speeding, seatbelt non-use, distracted driving, or impaired). EBP studying Violent and Property Crime Nexus to Traffic Safety

10 years of crash data Origin points for drivers involved in serious injury and fatality crashes o Broken down by causation o High risk roads often 2 -3 miles from towns o Towns are “hot spot” origin points for impaired or unsafe drivers (Responsible for >60% of fatal crashes in Area C) Identified two ‘hot towns’ within each county (for a total of 56 hot towns) and one roadway section for each county (an additional 28 hot roadways)
 Assigned 2 – 3")
Team of 16 Troopers participated Full-Time for one year (2018) Assigned 2 – 3 Counties / Shift Random and Intermittent ‘Touches’ Tracking ‘TOUCH’ Dosage (Date, Hot Spot, Time in, Time out, Interaction type/Action taken)
 Patrolling Parked in plain view")
Touches – What are they? Traffic stops (high profile) Patrolling Parked in plain view (School etc. ) Discussions with citizens in public places (Elevator Speech) Going where you aren’t expected, when you aren’t expected (leaving lasting – residual effects)

‘Touches’ Visibility in key locations Regular but unpredictable presence High profile stops as needed Deterrence effect Focusing on positive – non-punitive citizen interactions Bar owners and patrons, store and gas station workers Emphasize safety messages, leave safety literature Encourage voluntary compliance, change norms
 Hotspot")
Tracking ‘TOUCH’ Dosage (Date, Hot Spot, Time in, Time out, Interaction type/Action taken) Hotspot # Location Time In Time Out 10 -4 - Lamont Convenience Store/Gas Station 3: 18 3: 36 33 -3 Fayette Roadway/Highway 6: 41 6: 55 10 -1 - Independence convenience Store/Gas Station 9: 34 9: 47 Action Taken Notes Visibility & Presence Only in Patrol Fuel at BP Car Memorandum Traffic stop on High 150 Discussions w/ Citizens in Bar/Store Stopped at BP for snack
 Koper, C.")
Changing Human Behavior - Random and Intermittent Interactions (15 – 20 minutes) Koper, C. S. (1995). Just enough police presence: Reducing crime and disorderly behavior by optimizing patrol time in crime hot spots. ” Justice Quarterly 12(4), 649– 72. Need for perceived threat of arrest and/or citation Nagin, D. S. , Solow, R M. , & Lum, C. (2015). Deterrence, criminal opportunities, and police. Criminology: An Interdisciplinary Journal, 53(1), 74– 100. - What They Do Matters (‘Touches’) Sherman, L. W. (1990). Police crackdowns: Initial and residual deterrence. Crime and Justice, 12, 1– 48. In rural areas – blanketing the Area / Increasing the perception of LE coverage

Year #1 = 9684 ‘Touches’ Immediate citizen feedback of increased presence Decreased alcohol sales regionally Increase in all 20 Seatbelt count locations within Area C State compliance rate rose from 92% to 94% due to the increase in Area C One county increasing from 85% to 95% in one year.

Touches by County, Hot Spot ▪ Year 1 program: 9, 684 touches in total ▪ 346 per county on avg (1 per day) – Range of 84 to 1, 331 total visits per county ▪ 115 per hot spot on avg (1 every 3 days) – Range of 22 to 1, 135 total visits per hot spot Success is NOT measured in citations or arrests, but through crash reduction. 14

Touches by Month, 2018 1200 1000 800 600 400 200 0 Jan Feb Mar Apr May Jun Jul Aug Sep Oct Nov Dec 15

Patrol Locations for 2018 8000 7000 6000 5000 4000 3000 2000 1000 0 Road Bar Convenience Store Other 16

Patrol Actions, 2018 4500 4000 3500 3000 2500 2000 1500 1000 500 0 Visibility Discussion Memo Citation 17
 350 300 250 200")
Accidents Resulting in Serious Injury or Death (ISP Area C) 350 300 250 200 150 100 50 0 2013 2014 2015 2016 2017 2018 18
 500 450 400")
Accidents Due to Alcohol or Drugs, 2013 -2018 (ISP Area C) 500 450 400 350 300 250 200 150 100 50 0 2013 2014 2015 2016 2017 2018 19
 140 Program Start")
Accidents Due to Alcohol or Drugs, 2017 -2018 (ISP Area C) 140 Program Start 120 100 80 60 40 2017 Q 1 2017 Q 2 2017 Q 3 2017 Q 4 2018 Q 1 2018 Q 2 2018 Q 3 2018 Q 4 20
 120 100 80 60 40")
Accidents Due to Speeding, 2013 -2018 (ISP Area C) 120 100 80 60 40 2013 2014 2015 2016 2017 2018 21
 40 Program Start 35 30")
Accidents Due to Speeding, 2017 -2018 (ISP Area C) 40 Program Start 35 30 25 20 15 10 5 0 2017 Q 1 2017 Q 2 2017 Q 3 2017 Q 4 2018 Q 1 2018 Q 2 2018 Q 3 2018 Q 4 22

YEAR #2 Identifying a sustainable model Participation of all personnel on a limited basis – instead of 16 full-time Asking for a minimum of three touches per day (one hour) Remaining 8 hours each day for regular enforcement

YEAR #2 30, 654 Touches All indications are crashes trending the same direction from 2018 to 2019 (More to come…)

Questions? Captain Ken Clary Iowa State Patrol clary@dps. state. ia. us
- Slides: 25