
Utilization of GIS in Japan Hiroyuki KITADA Yumi

- Slides: 25
Utilization of GIS in Japan Hiroyuki KITADA , Yumi SEKINE National Statistics Center Japan
Content �Outline and Advantage of GIS �Utilization of Census data in GIS �Services by the “e-stat” �Grid square statistics �Densely Inhabited District �Challenge �Conclusion
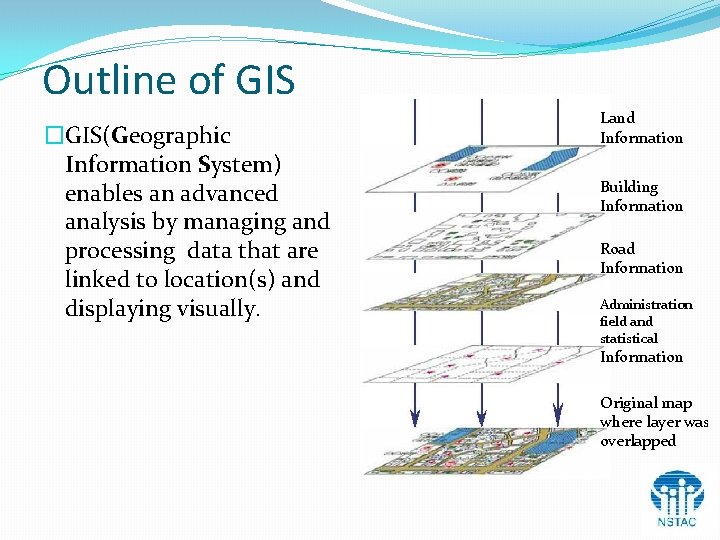
Outline of GIS �GIS(Geographic Information System) enables an advanced analysis by managing and processing data that are linked to location(s) and displaying visually. Land Information Building Information Road Information Administration field and statistical Information Original map where layer was overlapped
Advantage of GIS ü The display control in the map can be freely done. (expansion, reduction of the map, and movement of the display position) ü Measurement of distance and area can be easily calculated. (measurement of distance between arbitrary points, area measurement in arbitrary area) ü Data with the address can be automatically displayed in the map. ü The information extraction can be done easily by using the map. (classification display, map expression that corresponds to the condition of designation) ü Effective expression can be freely done according to the purpose. (It is possible to express it in the classification chart, the ranking map (choropleth map), and the graph chart and the distribution map) ü Three dimensional analyses can be done. (Bird's-eye view and the cross section, etc. can be made. )
Example of Using GIS Data �Compilation of small area statistics �Compilation of Grid-Square(Mesh Blocks) Statistics �Demarcation of DID(Densely Inhabited District) GIS data is used in various fields such as universities and research laboratories including the local public entity that promotes the regional administration.
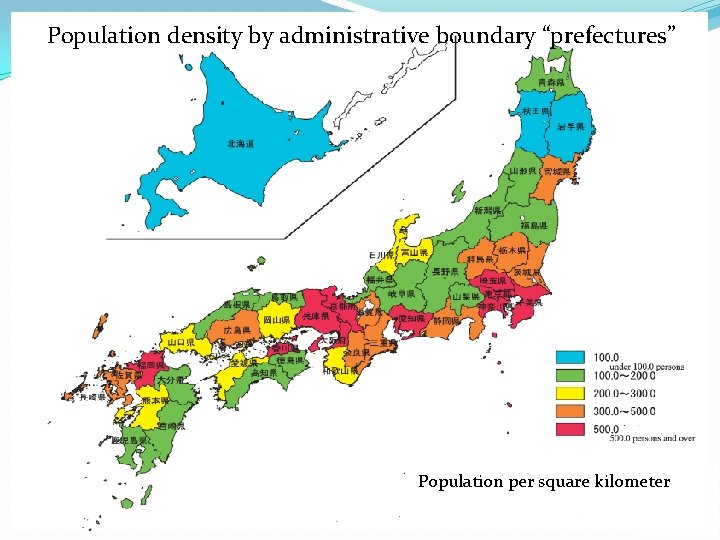
Population density by administrative boundary “prefectures” Population per square kilometer
Relation between GIS and Census data �GIS is used to decide “basic unit district” of Population Census. �GIS is formed with the census data which is based on “basic unit district”. �GIS is used to analyze small area statistics. �Statistical map can be made by using the data of Population Census. �Data of the Census can be used in 2005, 2000, 1995 now. �Statistical map that links Population Census with Establishment and Enterprise Census can be made.
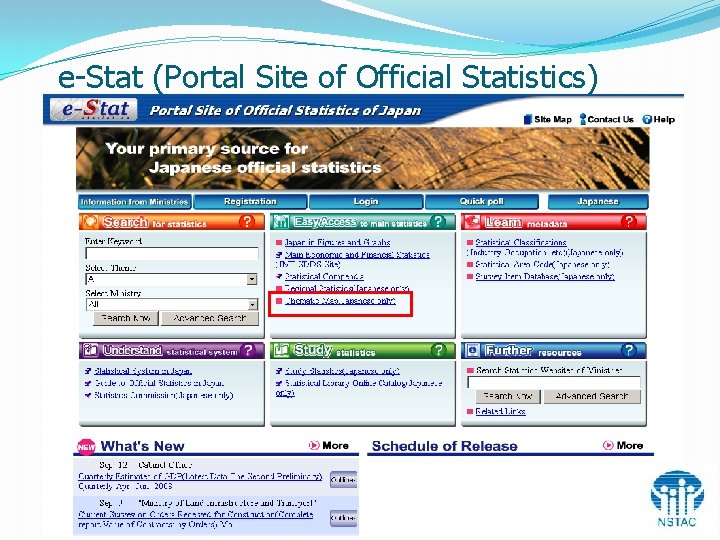
e-Stat (Portal Site of Official Statistics) 8
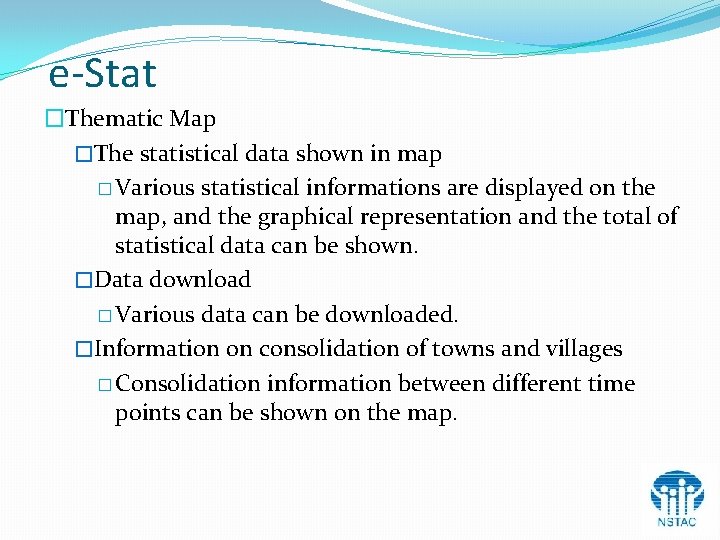
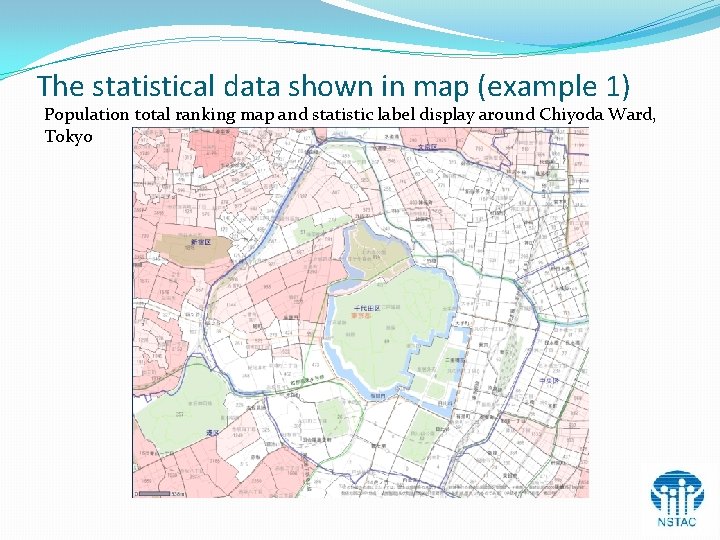
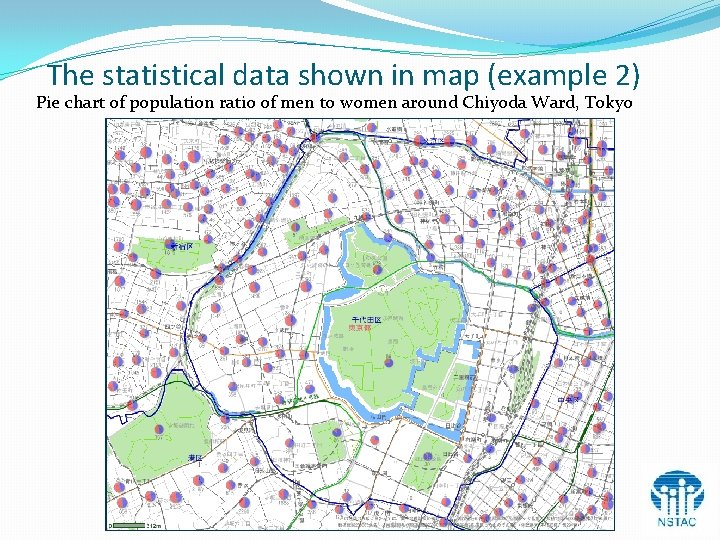
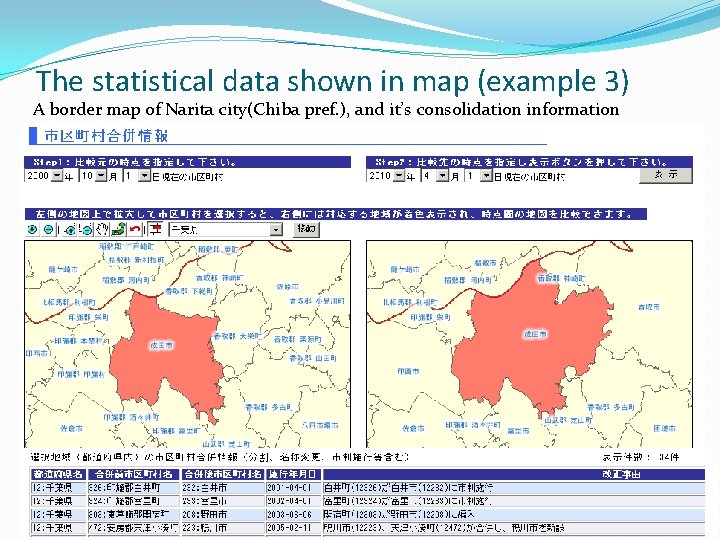
e-Stat �Thematic Map �The statistical data shown in map � Various statistical informations are displayed on the map, and the graphical representation and the total of statistical data can be shown. �Data download � Various data can be downloaded. �Information on consolidation of towns and villages � Consolidation information between different time points can be shown on the map.
The statistical data shown in map (example 1) Population total ranking map and statistic label display around Chiyoda Ward, Tokyo
The statistical data shown in map (example 2) Pie chart of population ratio of men to women around Chiyoda Ward, Tokyo
The statistical data shown in map (example 3) A border map of Narita city(Chiba pref. ), and it’s consolidation information
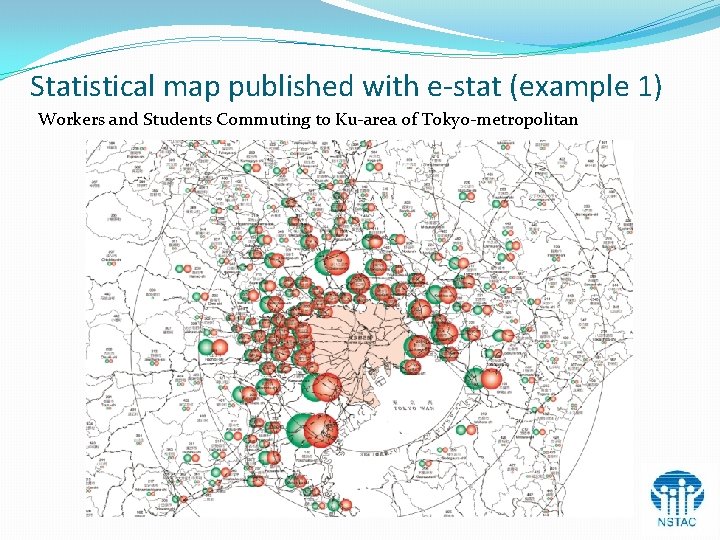
Statistical map published with e-stat (example 1) Workers and Students Commuting to Ku-area of Tokyo-metropolitan
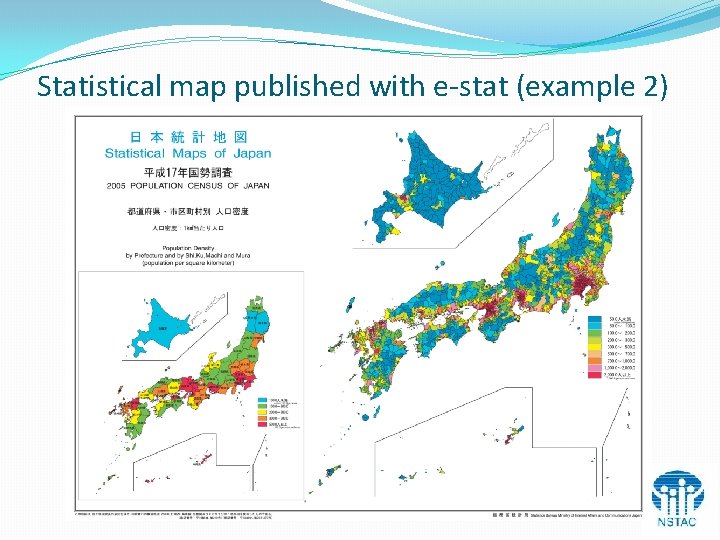
Statistical map published with e-stat (example 2)
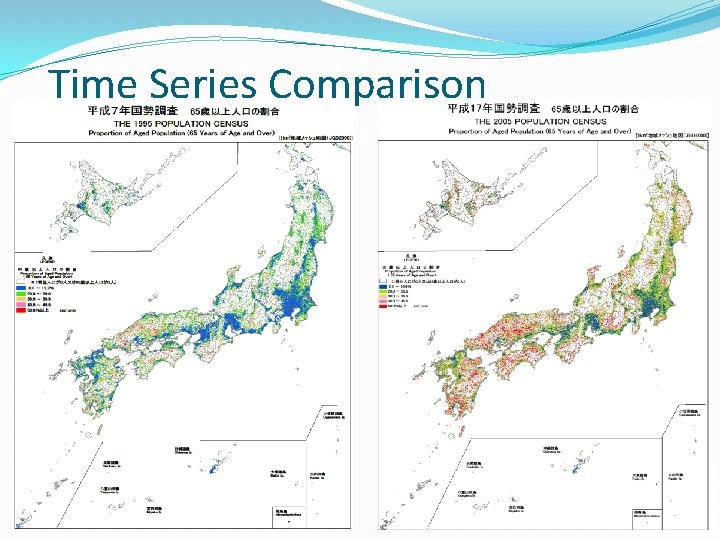
Grid Square Statistics Ø Administrative boundaries have varied sometimes == time series comparison becomes difficult Ø Administrative boundaries are not suitable for small area analysis The Statistics Bureau has reorganized the result of the Population Census and the Establishment and Enterprise Census into small regional square of approximately 1 km 2 and 0. 25 km 2, dividing the whole area of Japan by latitude and longitude.
Grid-Square(Mesh Blocks) Advantage of Grid-Square l Quantitative comparisons between mesh blocks are easy. l Time series comparisons of the region are easy. l The data of a particular region can be easily acquired. l Analysis, calculation and comparison related to the distance are easy.
Time Series Comparison
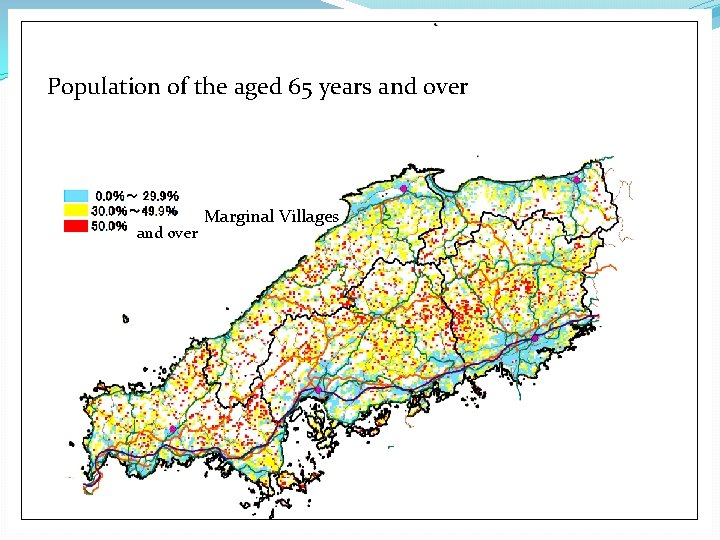
Population of the aged 65 years and over Marginal Villages
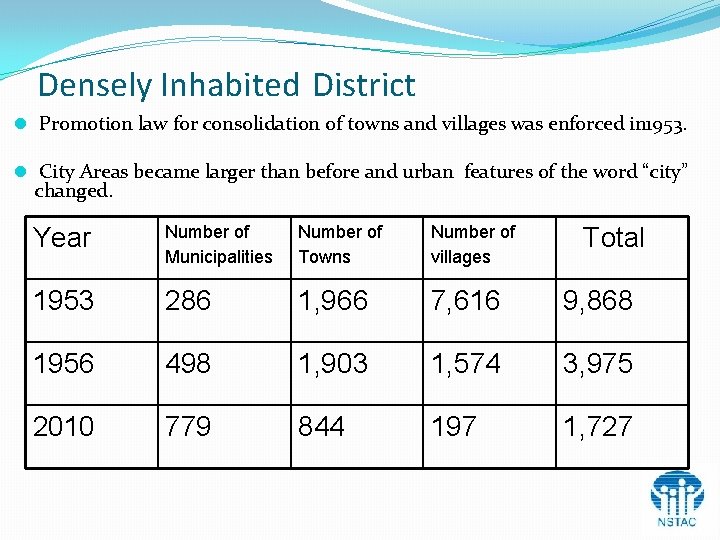
Densely Inhabited District l Promotion law for consolidation of towns and villages was enforced in 1953. l City Areas became larger than before and urban features of the word “city” changed. Year Number of Municipalities Number of Towns Number of villages 1953 286 1, 966 7, 616 9, 868 1956 498 1, 903 1, 574 3, 975 2010 779 844 197 1, 727 Total
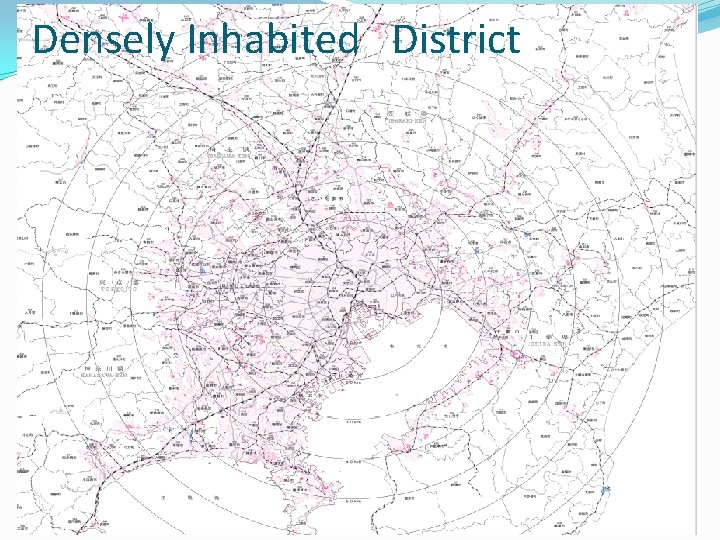
Densely Inhabited District l A DID was established as one of regional presentations for Population Census 1960. l A DID consists of adjoining basic unit districts that have high population density of 4, 000 person/Km 2 and overall population adds up to 5, 000 residents or more. l A DID is used as one of calculation criteria for the amount of Local Allocation Tax which is annually grated from the national government to the local government. l A DID is also used as a basis for planning policy such as town planning, redevelopment of urban areas, or disaster prevention measures.
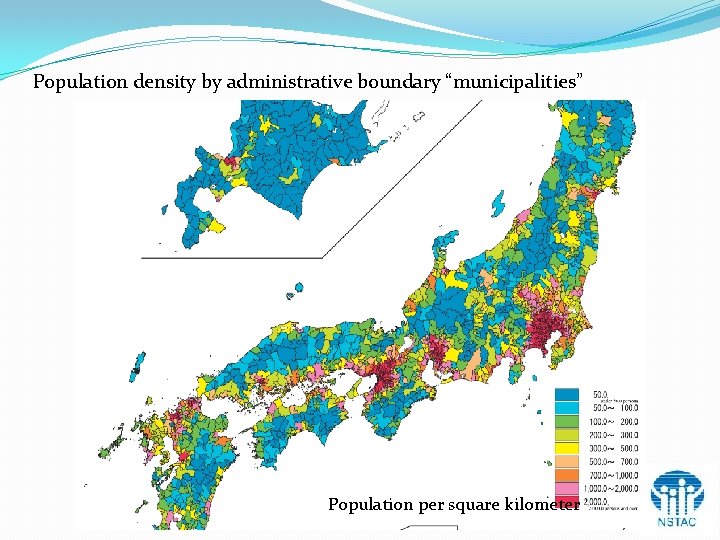
Population density by administrative boundary “municipalities” Population per square kilometer
Densely Inhabited District
Challenges �Consideration of setting standards of metropolis areas �Adaptation to system change (change of operating system etc. )
Conclusion l The Census data takes an important role in GIS. l GIS is used to decide the basic unit district of the Census. l Utilization on web l Web-GIS l Statistical maps can be made on web. l Statistical maps that Statistics Bureau published can be browsed on web. l Challenge of GIS in the future l Consideration of setting standards of the metropolis areas
Thank you for your attention!