UTILITY OF MODIFIED LOCUST BEAN GUM FOR DISSOLUTION

UTILITY OF MODIFIED LOCUST BEAN GUM FOR DISSOLUTION IMPROVEMENT OF POORLY SOLUBLE DRUG PHARMACEUTICS & NOVEL DRUG DELIVERY SYSTEM, DUBAI, UAE KANAV MIDHA CHITKARA UNIVERSITY, INDIA

CONTENTS q INTRODUCTION q SOLID DISPERSIONS, TYPES, PREPARATION, ADVANTAGES & LIMITATIONS q MATERIAL & METHODS q DRUG & POLYMER PROFILE q RESULTS & DISCUSSIINS q CONCLUSION q REFERENCES

INTRODUCTION q Solubility is an important parameter to achieve desired concentration of drug in systemic circulation for pharmacological response to be shown. Poorly water soluble drugs are increasingly becoming a problem in terms of obtaining the satisfactory dissolution within the GIT that is necessary for good bioavailability. q The Biopharmaceutical Classification System (BCS System) is a scientific framework for classifying a drug substance based on its aqueous solubility and intestinal permeability.
 • H-P • H-S • Class II (acceptable)")
BCS CLASSIFICATION • Class I (appropriate) • H-P • H-S • Class II (acceptable) • H-P • L-S • Class III (problematic) • L-P • H-S Propanolol, Metaprolol, Diltiazam, Verapamil, Water soluble vitamins Acyclovir, Captopril, Elanapril, Neomycin B Nifedipine, Nicardipin, Felodipin, Ketoconazole Chlorthiazid, Furosemid, Tobramycin, Cefuroxim • Class IV (inappropriate) • L-P • L-S H- High L- Low P- Permeability S- Solubility

SOLUBILISATION TECHNIQUES Physical Modification Chemical Modification Miscellaneous Micronization Change in p. H Surfactants In situ crystallization Complexation Hydrotrophy Super Critical Process Salt formation Co solvency Polymorphs Liquisolid compacts Solid Dispersion Micellar solublisation

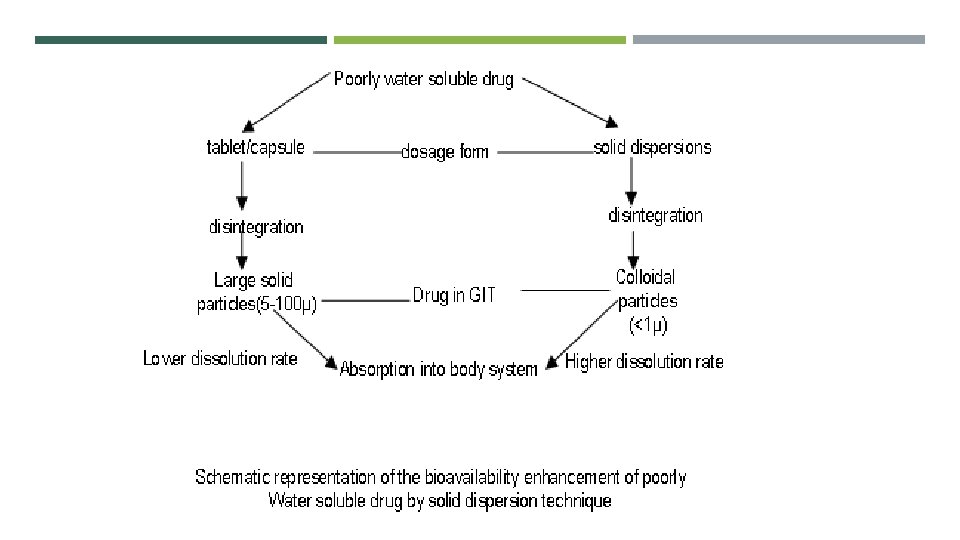
Solid Dispersion q Sekiguchi and Obi first introduced the concept of using solid dispersions to improve bioavailability of poorly water-soluble drugs in 1961. They demonstrated that the eutectic mixture of sulphathiazole and the physiologically inert water-soluble carrier urea exhibited higher absorption and excretion after oral administration when compared with sulphathiazole alone. q The term ‘Solid Dispersion’ refers to a group of solid products consisting of at least two different components, generally a hydrophilic matrix and a hydrophobic drug. The matrix can either be crystalline or amorphous. q It is the science of dispensing one or more active pharmacological ingredients in an inert matrix in the solid stage in order to: • Obtain sustained release dosage form • Enhancing the dissolution rate • Enhance the release of drugs from ointment and suppository bases • Improve the solubility and stability of active pharmacological ingredients (API)

Solid Dispersion Type Remarks No. of Phases First type of Solid Dispersion prepared 2 II. Amorphous precipitation in crystalline matrix Rarely encountered 2 III. Solid Solutions Various types are as follows: I. Eutectics A. Continuous Solid Solution Miscible at all composition never prepared Solid Dispersion Type Remarks No. of Phases D. Interstitial Solid Solution Drug (solute) molecular diameter less than 59% of matrix (solvent) diameter. Usually limited miscibility, discontinuous. Eg: Drug in helical interstitial spaces of PEG* 2 IV. Glass Suspension Particle size of dispersed phase dependent on cooling/evaporation rate. Obtained after crystallization of drug in amorphous matrix 2 Requires miscibility or solid solubility, complex formation or upon fast cooling or evaporation during preparation Eg: with PVP 2 1 V. Glass Solution B. Discontinuous Solid Solution Partially miscible, 2 phases even though drug is molecularly dispersed 2 C. Substitutional Solid Solution Molecular diameter of drug (solute) differs less than 15% from the matrix (solvent) diameter. Can be continuous or discontinuous; when discontinuous, 2 phases even though drug is molecularly dispersed 1 or 2 * Chiou & Reigelman, 1971, 1969

ADVANTAGES q Increased Dissolution Rate q Enhanced oral bioavailability q Processing equipment available at small and large scale q Most carriers can act as “solid” solvent q Carriers (mainly surface active agents) can maintain supersaturation in GI tract

LIMITATIONS q During processing or storage, the amorphous state may undergo crystallization and dissolution rate decrease with aging. q Most of the polymers used in solid dispersions can absorb moisture, which may result in phase separation, crystal growth or conversion from the amorphous to the crystalline state or from a metastable crystalline form to a more stable structure during storage. This may result in decreased solubility and dissolution rate.

MATERIAL & METHODS MATERIAL AND METHODS

Chemicals Used: - Instruments Used: - Instrument Excipients and chemicals Commercial source UV visible double beam spectrophotometer Glimepiride Locust Bean Gum (LBG) Ethanol Potassium dihydrogen orthophosphate Sodium hydroxide pellets Manufacturer Model Number Systronics, Ahmedabad, India AU – 270 i Comed Pharmaceutical Pvt. Ltd. , Micropipette tip Tarsons J 16210511 India ATR-FTIR Alpha Bruker, Germany IFS 66/S Rotary evaporator Perfit India - Orbital shaking incubator REMI Instruments , India IHB. 083 p. H meter Systronics, Ahmedabad, India Digital weighing balance Denver instruments, India S 1 – 234 Tapped density apparatus Microsil, Ambala, India - XRD X’pert Pro PW 3050 Lucid Colloids Ltd. , India Changshu Yangyuan chemical , China Loba Chemicals , India Merck Pharmaceuticals , India µp. H systems 361 Dissolution Test Apparatus Lab India, Pune, India DS 8000 SEM JEOL , USA - Dessicator Perfit, India - DSC Mettler Toledo, USA DSC 821 e Brookfield viscometer Middlebro, MA, USA DV-E Perfit, India - Digital melting point apparatus
 Melting point : Melting point")
1. Preliminary studies: Identification of drug and polymer: a) Melting point : Melting point of the drug was determined by using melting point apparatus. b) UV spectroscopy: Calibration curve of Glimepiride was prepared in phosphate buffer (p. H 6. 8). Stock solution was prepared by dissolving 50 mg of Glimepiride in 5 ml of methanol in volumetric flask (50 ml); volume was made up by phosphate buffer (p. H 6. 8). Different dilutions (2 -18 µg/m) were prepared by diluting stock solution with phosphate buffer p. H 6. 8 and absorbance was measured by UV visible double beam spectrophotometer at 226 nm. 2. Modification of LBG and evaluation of LBG and MLBG: a) Modification of locust bean gum: Locust bean gum was placed in porcelain dish and heated on sand bath for 2 h. The polymer was stirred continuously with spatula to avoid charring of the polymer. The temperature of the bath was kept between 80˚C to 100˚C. The prepared modified locust bean gum (MLBG) which was light brown in colour was sieved through the #80 seive and kept in air tight container away from moisture at room temperature.

Formulation of various mixtures 1. Preparation of solid dispersion: Solid dispersions were prepared by solvent evaporation method. In this method, the drug Glimepiride and polymer MLBG were mixed in the ratio 1: 2, 1: 4, 1: 6, 1: 8 and 1: 10 in 25 ml ethanol in round bottom flask of rotary evaporator. The assembly was set and solvent was removed by using rotary evaporator. The temperature of water bath was kept at 60 C. The resultant solid dispersions were sieved through 80 # sieve and stored in air tight containers at room temperature. Table shows the composition of various mixtures. Batch 1: 6 was optimized and various other mixtures were then prepared. 2. Preparation of various other mixtures: a. Preparation of physical mixture: Accurately weighed Glimepiride (100 mg) and modified locust bean gum (600 mg) were mixed thoroughly with the help of a spatula the mixture was sieved through 80 # mesh and stored in air tight containers at room temperature. b. Preparation of co- grinding mixture: Accurately weighed drug Glimepiride (100 mg) and modified locust bean gum (600 mg). Placed the drug in mortar and grinded the mixture properly. The mixture was collected and passed through 80 # mesh sieve. The mixture was stored in air tight container at room temperature. c. Preparation of kneading mixture: Accurately weighed drug Glimepiride (100 mg) and modified locust bean gum (600 mg). were placed in mortar and kneaded with small quantity of ethanol. The kneaded mixture was placed in hot air oven until the constant weight of the mixture was obtained. After the complete drying (evaporation of the solvent) the mixture was collected and passed through the 80 # sieve. The mixture was stored in air tight container at room temperature.
 Polymer MLBG (mg) SD 1 100 200 SD 2 100")
Formulation code Drug (mg) Polymer MLBG (mg) SD 1 100 200 SD 2 100 400 SD 3 100 600 SD 4 100 800 SD 5 1000 PM 100 600 CGM 100 600 KM 100 600

Characterisation of solid dispersions 1. Equilibrium solubility studies The equilibrium solubility of Glimiperide, solid dispersion, physical mixture , kneading mixture and co-grinding mixture was determined in p. H 6. 8 phosphate buffer at 37⁰C. For each preparation an equivalent of 10 mg of drug was added to 50 ml of buffer in conical flasks and covered with the foil. The flasks were kept in shaking incubator for 24 h at 37⁰C. after shaking flasks were kept in the incubator for equilibration for 12 h. The solution was filtered and then assayed At 226 nm. 2. Content uniformity Accurately weighed amount( 5 mg) of solid dispersion were dissolved in 10 ml methanol in 100 ml volumetric flask and volume was made upto the mark using 6. 8 phosphate buffer. The solution was filtered and content uniformity was analysed at 226 nm. 3. Fourier Transform IR Spectroscopy (FTIR) The infrared (IR) spectra of samples were obtained using an Attenuated Total Reflectance-Fourier Transform Infra-Red (ATR-FTIR) spectrophotometer (Alpha, Bruker, germany). The samples were scanned in the spectral region of 4000 cm − 1 to 400 cm− 1 4. Differential Scanning Calorimetry (DSC) The thermal transitions of samples were investigated with the use of a Mettler Toledo DSC 821 apparatus, calibrated by using a high purity indium standard. Samples about 10 mg were hermetically sealed in flat bottomed aluminium pans and heated in an atmosphere of nitrogen to eliminate the oxidative and pyrolitic effects. The heating rate was 10ºC/min in a temperature range of 25– 300 ºC. The DSC thermograms were recorded. 5. Scanning Electron Microscopy (SEM) The scanning electron micrographs taken for studying surface morphology were accumulated using a Hitachi S 3400 N SEM. The samples were stuck on a specimen holder using a silver plate, and then coated with palladium in a vacuum evaporator. An accelerator potential of 10 k. V was used during the micrograph
 The X-ray powder diffraction patterns were traced employing X-ray")
6. X-Ray Powder Diffraction (XRD) The X-ray powder diffraction patterns were traced employing X-ray diffractometer using Ni filtered cu(k-α)radiations in an X-Pert Pro (USA). The diffractometer was operated at 40 m. A and 45 Kv. The signals of the reflection angle of 2θ were recorded from 0º to 50º at a scanning rate 20º/sec. 7. In vitro dissolution studies In-vitro dissolution of various mixtures was studied in USP dissolution apparatus II (DS 8000, Lab India) in 900 ml of phosphate buffer p. H 6. 8 at 37± 0. 5 ºC as a dissolution medium. Aliquots of 5 ml each were withdrawn at specified time intervals (0, 15, 30, 45 and 60, 90 and 120 min) and replaced with equal volume of fresh medium. The withdrawn aliquots were filtered analyzed for drug content using a UV double beam visible spectrophotometer (2202, Systronics, India) at λmax 226 nm. The study was done in triplicate. Drug concentration was calculated and expressed as cumulative percent of the drug released.

IN VIVO STUDIES Male Wistar rats weighing 250± 20 g, maintained on standard laboratory diet (Ashirwad Feed Industry, Chandigarh, India) and having free access to tap water were employed in the present study. They were housed in the departmental animal house and were exposed to 12 hr cycle of light and dark. The experiments were conducted in a semi-sound proof laboratory. The experimental protocol was approved by institutional animal ethics committee and care of the animals was carried out as per the guidelines of committee for the purpose of control and supervision of experiments on animals (CPCSEA), Ministry of Environment and Forest, Government of India (Chitkara College of Pharmacy Animal Facility Registration Number: 1181/ab/08/CPCSEA).

Experimental Induction of Diabetes: Animals were allowed to fast for 12 hrs and were administered freshly prepared alloxan (160 mg/kg body weight i. p. ) in freshly prepared saline water. The alloxan treated animals were allowed to food over night to overcome drug-induced hypoglycemia. After 72 hrs to allow for the development and aggravation of diabetes, rats with moderate diabetes having persistent glycosuria and hyperglycemia were considered diabetic for further experimentation. Experimental Design: In the experiment, a total of 30 rats (25 diabetic surviving rats, 5 normal rats) were used. Group I (Normal group) receives only vehicle. Group II was selected for diabetic control. Group III stands for pure powdered form of glimepiride (2 mg/kg, i. p) control group, Group IV, solid dispersion of glimepiride (2 mg/kg, i. p) Group V, glimepiride CGM (2 mg/kg, i. p). The dosage was prepared in solution form in such a concentration that, each 0. 5 ml of solution contains those drugs corresponding to the volume of 5 ml/kg body weight. The blood samples collected from tail vain were analyzed for blood glucose content at 0, 30 min, 1 hr, 2 hr and 3 hours respectively by using Accu check active glucometer.

Statistical Analysis: The values were expressed as mean ± SEM. The data was subjected to the analysis of variance (one way ANOVA) to determine the significance of changes followed by students “t”-test. The statistical significance of difference between two independent groups was calculated for the determination of blood glucose levels.

DRUG & POLYMER PROFILE

Name Glimepiride Synonyms Glimepirid, Glimepirida, Glimepiridum, Glimepride Description Glimepiride is the III generation sulphonyl urea. Brand Names Amarel, Amaryl, Endial, Novo-glimepiride, PMS-glimepiride, Ratio-glimepiride Chemical IUPAC Name 3 -ethyl-4 -methyl-N-[2 -[4 -[(4 -methylcyclohexyl)carbamoylsulfamoyl]phenyl]ethyl]-2 -oxo-5 H-pyrrole-1 carboxamide Chemical Formula C 24 H 34 N 4 O 5 S Chemical Structure Molecular Weight 490. 22 g/mol Melting Point 207 °C Drug Category Hypoglycemic Agents Solubility Sulfonylurea Practically insoluble in water, soluble in dimethyl formamide, slightly soluble in methylene chloride Half Life 5 h Dose 1 -2 mg Protein Binding 99. 5% bound to plasma protein

Polymer Locust Bean Gum Synonyms Carob gum, Carob bean gum, Carob flour, St. john’s bread, Gomme de caroube Biological Source Obtained from the endosperm of the seed of the carob (locust) tree, Ceratonia siliqua (L. ) Taub (Fam. Leguminosae). Chemical Composition It consists mainly of a neutral galactomanan polymer made up of 1, 4 -linked D-mannopyronosyl units and every fourth or fifth chain unit is substituted on C 6 with a D-galactopyranosyl unit. 0 The ratio of D-galactose to D-mannose and this is believed to be due to the varying origins of the gum materials and growth conditions of the plant during production. Chemical Structure Appearance Off white to cream powder odorless and tasteless in the dry powder form Solubility Requires heating to 85°C for at least 10 minutes for complete solubility in water. Viscosity 2400 – 3400 cps p. H 5. 0 – 7. 5

RESULTS & DISCUSSIONS
 Melting point: Melting point of the drug was found to be")
PRELIMINARY STUDIES: a) Melting point: Melting point of the drug was found to be 207 °C which is within the specified limits. b) UV absorption: The absorbance data is mentioned in Table 5. 1 and the calibration curve is shown in Figure 5. 1 Absorbance (mean±SD), n = 3 S. No Conc ( µg/m) 1 0. 00 ± 0. 00 0. 8 2 0. 16 ± 0. 002 0. 7 3 4 0. 25 ± 0. 18 0. 6 4 6 0. 34 ± 0. 009 5 8 0. 44 ± 0. 001 6 10 0. 52 ± 0. 001 0. 3 7 12 0. 59 ± 0. 001 0. 2 8 14 0. 674 ± 0. 001 9 16 0. 738 ± 0. 001 10 18 0. 816 ± 0. 001 absorbance 0. 9 0. 5 0. 4 R 2 = 0. 9861 0. 1 Table 5. 1: Concentration Vs. absorbance data of various dilutions 0 0 2 4 6 8 10 12 conc (µg/ml) 14 16 18 20 Figure 5. 1: Calibration curve of pure drug in phosphate buffer (p. H 6. 8)

EVALUATION OF VARIOUS MIXTURES Table 5. 3: Equilibrium solubility of drug and various mixtures Formulation Equilibrium solubility(µg/ml) Table 5. 4: Content uniformity of various mixtures Batch No. % Content Uniformity (Mean ± SD), n=3 (mean ± SD), n=3 SD 1 98. 1± 0. 4 SD 2 98± 1. 0 Pure drug 1. 39± 0. 02 SD 1 7. 09± 0. 13 SD 2 16. 72± 0. 42 SD 3 98± 1. 1 SD 3 23. 73± 0. 51 SD 4 97. 5± 0. 5 SD 4 15. 96± 0. 40 SD 5 98. 2± 0. 7 SD 5 13. 79± 0. 46 PM 97. 4± 0. 6 PM(1: 6) 11. 03± 0. 33 CGM(1: 6) 19. 61± 0. 29 CGM 98± 0. 9 KM(1: 6) 18. 01± 0. 52 KM 98. 1± 1. 2

Fig 5. 2: FTIR spectrum of Drug Glimepiride

Fig 5. 3: FTIR spectrum of MLB

Fig 5. 6: FTIR spectrum of SD 3

Fig 5. 11: Overlay diagram of FTIR of Glimepiride, MLBG SD 3 CGM, KM, PM (bottom to top)

Fig 5. 12: DSC thermogram of Glimepiride
, and SD")
Fig 5. 15: Overlay diagram of DSC of Glimepiride, CGM (1: 6), and SD 3 (bottom to top)
 pure drug at")
a b c Fig 5. 16: Scanning electron micrograph of a) pure drug at 3000 X b) SD 3 at 1500 X c) Physical Mixture at 3000 X d) CGM at 250 X e) KM at 3000 X d e

Fig 5. 25: Overlay diagram of X-RD of pure drug, MLBG, SD 3, CGM (bottom to top)

IN VITRO STUDIES % Drug Release ± SD Time PD SD 1 SD 2 SD 3 SD 4 SD 5 0 0 0 0 5 17. 79 ± 0. 80 19. 36 ± 0. 80 20. 93 ± 0. 52 24. 59 ± 0. 52 21. 97 ± 0. 52 120 100 PD 18. 97 ± 0. 53 80 24. 46 ± 0. 80 25. 98 ± 0. 79 27. 03 ± 0. 79 34. 88 ± 0. 79 31. 22 ± 0. 79 SD 1 28. 22 ± 0. 79 30 30. 22 ± 0. 30 33. 31 ± 0. 30 31. 74 ± 0. 30 47. 96 ± 0. 30 44. 82 ± 0. 30 36. 82 ± 0. 30 45 38. 19 ± 0. 52 42. 38 ± 0. 52 37. 15 ± 0. 79 54. 94 ± 0. 52 57. 55 ± 0. 52 48. 55 ± 0. 30 60 44. 47 ± 0. 52 45. 52 ± 0. 52 46. 04 ± 0. 52 75. 87 ± 0. 53 62. 26 ± 0. 53 56. 26 ± 0. 52 90 50. 04 ± 0. 52 47. 09 ± 0. 52 60. 17 ± 0. 52 84. 76 ± 0. 52 73. 25 ± 0. 53 61. 25 ± 0. 52 120 57. 44 ± 0. 79 52. 15 ± 0. 80 65. 75 ± 0. 80 87. 77 ± 0. 79 77. 26 ± 0. 79 70. 26 ± 0. 53 180 63. 67 ± 0. 38 57. 34 ± 0. 55 69. 56 ± 0. 70 96. 43 ± 0. 55 79. 46 ± 0. 75 75. 87 ± 0. 30 Table 5. 17: % drug release vs time data of pure drug (PD) and various SD batches % Drug Release 15 SD 2 60 SD 3 SD 4 40 SD 5 20 0 0 50 100 150 200 Time (minutes) Fig 5. 26: In vitro release profiles of pure drug (PD) and various solid dispersion batches

% Drug Release ± SD Time PD SD 3 PM CGM KM 0 0 18. 13 ± 0. 30 26. 51 ± 0. 30 32. 96 ± 0. 53 42. 90 ± 0. 52 0 19. 18 ± 0. 30 27. 77 ± 0. 52 c 36. 29 ± 0. 52 42. 56 ± 0. 80 0 45 ± 0. 80 46. 91 ± 0. 30 49. 53 ± 0. 53 51. 28 ± 0. 80 60. 88 ± 0. 30 69. 15 ± 0. 53 51. 97 ± 0. 44 78. 58 ± 0. 30 5 15 30 45 60 90 120 17. 79 ± 0. 80 24. 59 ± 0. 52 24. 46 ± 0. 80 34. 88 ± 0. 79 30. 22 ± 0. 30 47. 96 ± 0. 30 38. 19 ± 0. 52 54. 94 ± 0. 52 44. 47 ± 0. 52 75. 87 ± 0. 53 50. 04 ± 0. 52 84. 76 ± 0. 52 57. 44 ± 0. 79 87. 77 ± 0. 79 96. 43 ± 0. 55 63. 67 ± 0. 38 180 120 100 21. 97 ± 0. 52 80 26. 68 ± 0. 52 PD SD 3 37. 67 ± 0. 52 60 PM 46. 39 ± 0. 79 62. 61 ± 0. 30 % Drug Release 40 CGM KM 20 76. 39 ± 0. 53 80. 05 ± 0. 52 83. 31 ± 0. 40 0 0 20 40 60 80 100 120 140 160 180 200 Time (minutes) Table 5. 18 : %drug release vs time data of pure drug (PD) Fig 5. 27: In vitro release profiles of pure drug (PD), SD 3 and various mixtures and various solid mixtures

IN VIVO STUDIES Group Dose kg-1 0 hr 30 min. 1 hr. 2 hr 3 hr Vehicle Saline(5 ml/kg) 106. 55± 22. 09 105. 23± 18. 44 104. 55± 22. 09 105. 23± 18. 44 108. 16± 20. 32 ______ 350. 67± 22. 3* 355. 67± 22. 3* 348. 67± 22. 35* 346. 67± 22. 35* 345± 22. 35* Pure Drug 2 mg/kg 340. 67± 22. 35 a 225. 60± 20. 5 a 175. 60± 19. 45 a 145. 60± 18. 50 a 140. 60± 16. 53 a CGM 2 mg/kg 355. 67± 22. 35 b 210. 67± 20. 6 b 150. 67± 21. 6 b 126. 67± 16. 62 b 106. 67± 10. 6 b SD 3 2 mg/kg 348. 67± 22. 4*c 156. 60± 14. 73*c 92. 50± 9. 65*c 87. 50 ± 7. 52*c 82. 50 ± 5. 72*c control Diabetic control
 in powdered form were")
Discussion: Glimepiride formulations (F 1, F 2 and F 3) in powdered form were evaluated for their efficacy and potency in-vivo testing in wistar Rats. The drug was administered at a dose of 2 mg/kg body weight of Glimepiride solution. After oral administration of SD 3 a rapid reduction in blood glucose level was observed and maximum reduction was found at 50% within 1 hour. Maximum 75% reduction was found after administration of solid dispersion of Glimepiride after 3 hour. The significant reduction was considered at 75% blood glucose level. Blood glucose level was maintained for 3 hour after the treatment with solid dispersion of Glimepiride as compare to pure powdered form of Glimepiride. The Glimepiride solid dispersion formulation showed an instant hypoglycaemic effect due to a faster release and absorption of drug from the solid dispersion over a shorter period of time. Hence, this newly formulated Glimepiride in solid dispersion dosage form is a significant and potential than slow release glimepiride dosage form for the treatment of type-II Diabetes.

CONCLUSION q Dissolution improvement using MLBG is due to less viscosity of the polymer and slight conversion of drug from its crystalline to amorphous state. q SD 3 and CGM was found to be the optimum batch for dissolution enhancement of Glimepiride q In vivo studies conformed that after oral administration of SD 3 a rapid reduction in blood glucose level was observed, thus faster release and absorption of drug.

ACKNOWLEDGEMENT 1. Ms. Masha Rajput, Research Scholar, Chitkara College of Pharmacy, Chitkara University, India 2. Ms. Garima Singh, Research Scholar, Chitkara College of Pharmacy, Chitkara University, India 3. Ms. Manju Nagpal, Associate Professor , Dept. of Pharmaceutics, Chitkara College of Pharmacy, Chitkara University, India 4. Mr. Gurjeet Singh Thakur, Associate Professor and HOD Pharm D, Chitkara College of Pharmacy, Chitkara University, India


THANK YOU. . !!!
- Slides: 42