Utah Division of Water Resources Water Budget Process

Utah Division of Water Resources Water Budget Process July 21, 2011

Surface flows and diversions �USGS Stream gauges �Reservoir storage and release records �Municipal potable and secondary diversion records �Diversion records from river commissioners �Water rights �USGS mean annual reach estimates �USGS Streamstats �Area Altitude �Other irrigation company records

Reservoir operations �Elevation-Area-Capacity tables gathered from State Engineer’s data, USBR records and past Water Resources studies. �Historical records obtained from irrigation company, federal or state archives. �Rainfall and evaporation estimates from PRISM data and Research Report 145.

Groundwater flows and diversions �Agricultural groundwater pumping from “Groundwater Conditions in Utah” estimates proportioned to subareas �Outside of major groundwater development areas, pumping allocated using Water Rights wells proportioned for use that year ≈ 5% of total. �Municipal groundwater usage from Division M&I Reports �USGS estimates of basin groundwater flows used to refine basin yield

Municipal and Industrial Consumptive use �Municipal records collected every 5 years �Water use records tabulate water use by: �Community systems �Non-community systems �Self-supplied industry �Commercial and Institutional uses are broken out into indoor and outdoor use. �Half of outdoor irrigation is assumed to be consumed. �A smaller portion of indoor use is consumed. �If evaporation ponds are used by system, that portion in excess of pond evaporation returns to system. Each system’s water treatment methods are tabulated. �Sources of supply (surface, groundwater, springs) for each system are identified.

Crop potential consumptive use �Crop acreages surveyed every 5 years �Cropland potential consumptive use �Blainey-Criddle crop coefficients from USU Research Report 145. �Soil moisture capacity from crops and STATSGO soils data. �Monthly temperature and precipitation from PRISM. �Cropland precipitation assumed to be 80% effective. �Winter carryover soil moisture reduced by 35%.

Crop potential consumptive usecont. �Cropland potential ET estimates aggregated within 12 digit HUCs. �Conveyance and on-farm efficiency by county provided by USU �corrected for individual subareas as needed. �Shortages occur whenever crop demand exceeds available supplies (surface diversions, pumped groundwater or available soil moisture) �Actual crop consumptive use is equal to potential consumptive use minus (shortages times irrigation efficiency).

Water Budget Process GIS maps are produced that show the relationship between cropland, municipalities, stream networks, stream gauges, pour points and reservoirs.

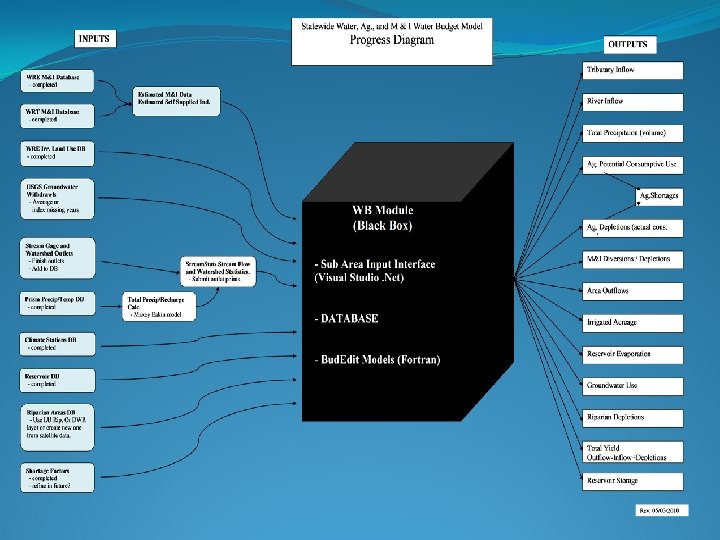
Modeling Process Flow logic diagrams

Coding

Documentation �GIS map �Logic diagram �Narrative description of assumptions and data �Model printouts �Database of important information from final run

Budget output Monthly and annual values for: • • • Total Precipitation Natural System Use Total Surface Supply Total Groundwater Use Inflow Outflow Agricultural Diversions Agricultural Depletions M&I Diversions M&I Depletions Wetland Depletions Yield

Potential future improvements �Adopt ASCE Penman Standardized ET calculation methods in the near future. �Explore methods to make annual irrigated cropland survey updates.
- Slides: 14