Using Visual Aids Visual aids can be a

Using Visual Aids Visual aids can be a very important element of your speech. It’s important to remember three basic tasks when showing a visual aid.

Visual Aids 1. Introduce the slide. Focus the audience’s attention to the slide. State the type of chart. For example: This pie chart shows the highest recycling rates by country. On this pie chart you can see the highest recycling rates by country.

Explain what the slide represents. Tell the audience what is on the chart. For example: The sections represent the different sexes. The colors represent the different sexes. 2.

3. Focus on one or two important points. Tell the audience what is important on the chart. For example: As you can see, X has the highest rate of recycling. The key point is that X has the highest rate of recycling.

Things to remember: Make sure the visual aid is visible for everyone to see. Use a large font so the words are easy to read. Avoid long sentences. Instead, try to use keywords and phrases. Use a simple background with lots of white space. Choose the best method of displaying the information.

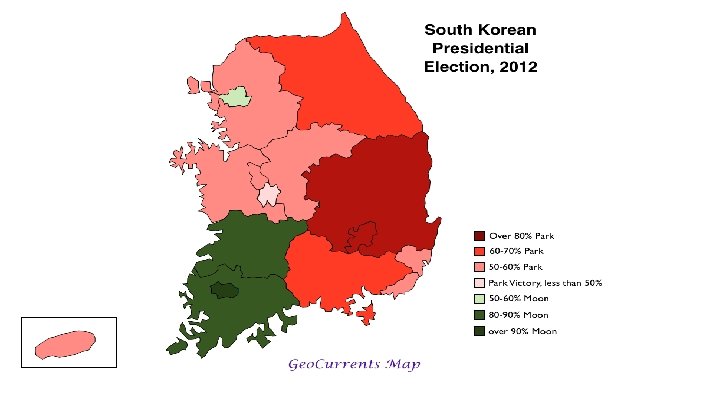
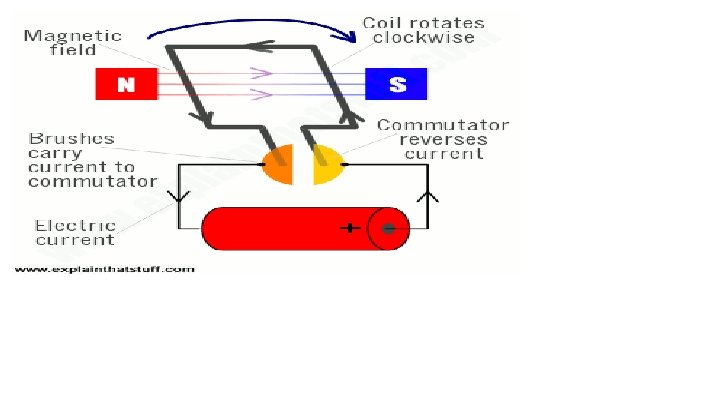
Vertical bar graph – rankings Horizontal bar graph – comparisons (i. e. , speed, time, distance) Pie chart – percentages Line graph – trends Diagrams – components or how something works Maps – places (i. e. , countries, cities) Photos – people

- Slides: 9