Using Vaccine Preventable Disease Surveillance Indicators for Evaluation
 Denise Woods-Stout")
Using Vaccine Preventable Disease Surveillance Indicators for Evaluation (of Reporting to CDC) Denise Woods-Stout Vaccine Preventable Disease Surveillance Co-Coordinator Communicable Disease Epidemiology Program Colorado Department of Public Health and Environment (CDPHE)

Vaccine Preventable Disease Surveillance Indicators, 1997 -2004 n The June 2006 CDC report reviewed indicators for Haemophilus influenzae (H flu), pertussis, measles, mumps and rubella n Report included National Summary n State Specific Summary n

Surveillance Indicators for Haemophilus influenzae, Colorado, 1997 -2004 Report Total Cases % % of Cases Complete <5 Years of Year Cases* <5 Years for 3 Key Age with Vaccine of Age Variables¶ Serotype History Testing 1997 1998 1999 2000 2001 2002 2003 22 21 15 33 38 35 40 7 6 5 13 3 4 7 2004 44 5 * Confirmed, and probable case status. 82 70 64 0 0 100 60 0 0 57 33 60 0 0 0 ¶Clinical case definition (e. g. specimen type), serotype, and vaccine history.
 Site n Active surveillance for")
Denver Metro Area is an Emerging Infections Program (EIP) Site n Active surveillance for H flu since July 2000 n All isolates are typed at state lab and CDC n Medical charts are reviewed for underlying conditions and vaccination records n H flu data should be complete for the majority of Colorado cases

Surveillance Indicators for Haemophilus influenzae, Colorado, 1997 -2004 % of Cases <5 Years of Age Report Total <5 with Serotype with Vaccine Year Cases* Years History Testing of Age CDC CO 1997 22 7 100 57 1998 21 6 100 33 1999 15 5 60 60 2000 33 13 0 85 0 77 2001 38 3 0 100 2002 35 4 0 100 0 75 2003 40 7 0 100 2004 44 5 0 100 * Confirmed, and probable case status. ¶Clinical case definition (e. g. specimen type), serotype, and vaccine history.

Where did the data go? n Use your disease investigation skills n Look at the chain of data transmission

Chain of Data Transmission n Cases reported to state/local health department n Cases entered into Colorado Electronic Disease Reporting System (CEDRS) n Cases investigated by health dept.

Chain of Data Transmission n Disease specific information entered into the Colorado Electronic Disease Reporting System (CEDRS) n Data reported to CEDRS during past week are transformed into a National Electronic Telecommunications System for Surveillance (NETTS) compatible file n File is sent electronically to CDC

Why are the H flu Data Missing? n Check with your computer programmer or Information Technology (IT) staff n Was the disease specific data extracted, transformed into a NETTS file, and sent to CDC?

What Went Wrong? n H flu disease specific data was not extracted from CEDRS or transmitted to CDC Immunization Program n H flu disease specific data was only transmitted to CDC Emerging Infections Program

Surveillance Indicators for Pertussis, Colorado, 1997 -2004 % of Clinically # Meeting Clinical Compatible Cases with Report # ¶ Case Definition Lab Testing Year Cases* CDC CO 415 1997 383 397 63 66 1998 357 326 350 55 57 1999 312 281 311 76 77 2000 487 473 474 69 65 2001 389 384 383 83 72 2002 464 455 457 87 74 2003 368 360 361 3 69 2004 1185 1126 1128 1 75 * Confirmed and probable cases. ¶ Clinically compatible.

Testing of 2003 and 2004 Colorado Pertussis Cases n CDC report indicates 1 – 3% of Colorado pertussis cases were tested n State data shows 69 – 75% of Colorado pertussis cases were tested

What Happened? n Pertussis disease specific data was transmitted to CDC n Pertussis information was not transmitted properly n There was a data shift, so PCR positive results were sent as “Not Done”

What is a Data Shift? n When a field is transmitted using an incorrect number of spaces all the information after that field is shifted n The information from that point forward is incorrect

Data Shift Examples n 8 -digit date is transmitted as a 5 - or 6 -digit date or vise a versa (02/27/2006 or 02/27/06 or 2/27/06) n Date is transmitted with or without dividing slashes (02/27/06 or 022706) n Unknown or unused dates are not accounted for with 99/99/99 placeholder n Cough duration is transmitted as 2 -digit number of days, not 3 -digit (56 vs. 056)

One Pertussis Case ASCII Space Delimited Transmission n M 908062053721270910190000010051958071 10470152060203111299999000020537280102 Y 02/03/06 YNYN 04/07/06 N 056 YXNNN 999 NY 302/ 27/0608999/99/9999 YX 02/27/06 X 02/ 27/0699/99/99 P 02/27/06 YU 99/99/99 UU 99/99/99 UU 9903/01/06 NN 99999999990916003 n Highlighted: case number, dob, cough duration, date of first specimen, and PCR result

Surveillance Indicators for Pertussis Cases < 7 Years of Age, Colorado, 1997 - 2004 Year 1997 1998 1999 2000 2001 2002 2003 2004 # Cases* < 7 Years of Age % of Cases < 7 Years of Age with Vaccine History CDC CO 190 122 108 182 115 143 112 264 191 125 115 182 115 143 109 265 8 23 18 57 56 47 51 33 95 95 93 98 97 97 99 98 * Confirmed and probable cases.

Differences in Pertussis Vaccine History Information 1997 - 2004 n CDC data indicates only 8 to 57% of the Colorado pertussis cases < 7 years of age had complete vaccine histories n State data indicates > 90% of the Colorado pertussis cases < 7 years of age had complete vaccine histories n CDC and CDPHE were viewing completeness of vaccine history differently
 n")
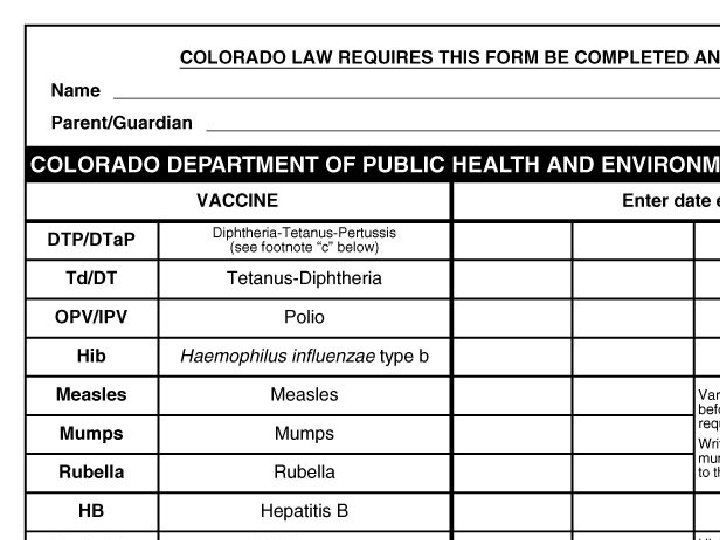
What Constitutes a “Vaccine History”? n Vaccinated = Yes or No (not Unknown) n If vaccinated provide: Vaccine date(s) n Vaccine type(s) - must be included to be considered complete for CDC 1997 – 2004 Surveillance Indicator Report n

No Vaccine Type = Incomplete Vaccine History n Review the source of your immunization information n Is vaccine type clearly indicated on the immunization records? n Colorado official Certificate of Immunization does not distinguish between DTP and DTa. P

Surveillance Indicators for Measles, CO 1997 - 2004 Year # Cases* % Complete for 10 Variables¶ % of Confirmed Cases that are Lab Confirmed CDC CO 2 10 NA 0 100 1 10 80 100 1997 1998 1999 2000 2001 2002 2003 2004 * Confirmed & Probable Cases. ¶ Clinical case definition, hospitalization, lab testing, vaccine info. , report date, transmission setting, outbreak related, epi-linked, dob & onset.

Colorado Measles, Mumps and Rubella Cases n Completed surveillance worksheets were mailed to CDC for each case n CDPHE assumed CDC entered the data from the worksheets into NETSS n CDC is not allowed to enter data into NETSS

Non-Electronic Data = No Data n Only basic information was transmitted to CDC electronically by CDPHE for measles, mumps and rubella cases n State electronic database did not include measles, mumps and rubella disease specific information n All Colorado measles, mumps & rubella cases were incomplete according to the CDC report

Why No Electronic Data? n Paying a programmer to write code for the small number of Colorado measles, mumps & rubella cases has not been a resource use priority

Colorado Measles, Mumps and Rubella n Reported in Colorado 1997 – 2004: n 3 Measles Cases n 25 Mumps Cases n 3 Rubella Cases

Colorado Measles, Mumps and Rubella n CDC will be using the Surveillance Indicator Report in the state grant funding process n Due to this and the recent mumps outbreak, CDPHE is revisiting the cost effectiveness of having computer code written to report measles, mumps and rubella electronically to CDC

Summary n CDC will be using the Surveillance Indicator Report in the state grant funding process n (Hopefully, future CDC Surveillance Indicator Reports will be more timely so problems may be corrected)

Summary n Investigate your surveillance indicator report if it appears incorrect n Determine the definition of the criteria CDC used in the report

Summary n Consult your computer programmer or IT staff n Check if disease specific data was captured and sent electronically to CDC

Summary n Determine whethere was a data shift in the disease specific information sent to CDC n Ensure there is disease specific information in your electronic database to send to CDC

Questions?
- Slides: 32