Using uncertainty analysis to provide sampling guidance in


: A statistical estimate of the")


 in")

- Slides: 12
Using uncertainty analysis to provide sampling guidance in monitoring fish and loons for mercury pollution Yang 1*, Ruth Yanai 1, Charley Driscoll 2, Geoffrey Miller 2, Nina Schoch 3, David Evers 4 State University of New York-ESF 1, Syracuse University 2 Adirondack Center for Loon Conservation 3, Biodiversity Research Institute 4
https: //www. google. com/search? q=no+fishing+mercury+sign&rlz=1 C 1 CHZL_en. U S 732 US 732&source=lnms&tbm=isch&sa=X&ved=0 ah. UKEwi. Esa. DBxqja. Ah. UCsl MKHfl. QDt. QQ_AUICyg. C&biw=1366&bih=662#imgrc=DF 16_FEya. NFOQM:
Adirondack Fish Monitoring Program Long-term 106 lakes 1992 -2016 Resurveyed 43 lakes 2000 s vs. 2010 s
Adirondack Loon Monitoring Program 111 lakes from 1998 to current https: //www. google. com/search? rlz &q=loon&oq=loon&gs_l= https: //www. google. com/search
Calculation of minimum detectable changes Minimum detectable change (MDC): A statistical estimate of the smallest amount of change that can be significantly detected EPA Technical Memorandum #3
Calculation of minimum detectable changes A. Detecting a change between two points of a time Paired t-test 43 resurveyed lakes in 2000 s vs. 2010 s Two sample t-test B. Detecting changes over a time series 111 lakes from 1998 to 2016
MDCs using paired/two sample t-test Resurveyed Objectives: how many lakes do we need? 43 lakes 2000 s vs. 2010 s Z = standard normal probabilities N = sample size S 2 = pooled variance
MDCs varied by species
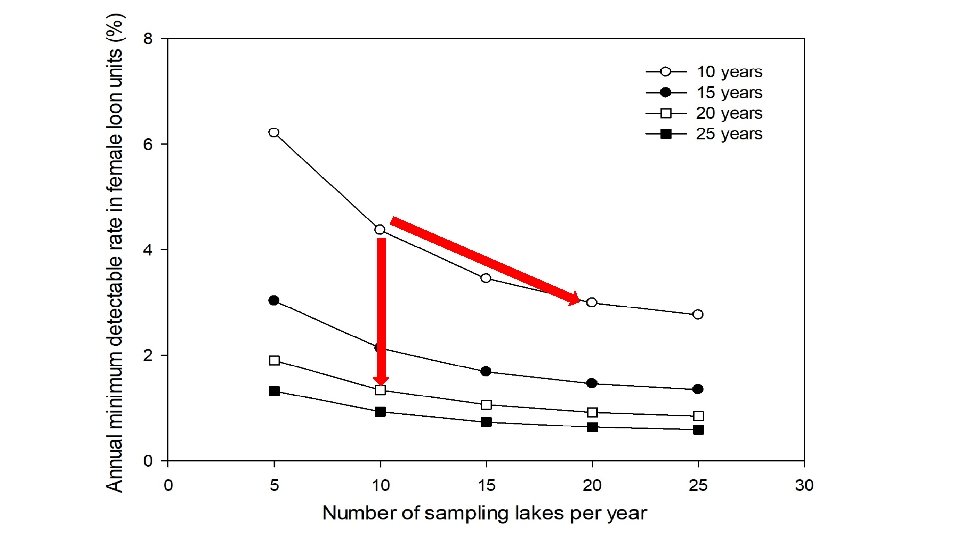
Changes over time 111 lakes from 1998 to 2016 Objectives: how many lakes per year and how many years? Resampling from 886 observations a. for 5 -25 lakes and 5 -20 years b. with 5000 iterations N = number of years CV = temporal variation T = the test statistic of the T-test CV = temporal variation
Other methods of uncertainty analysis Power analysis Statistical programs ‘fishmethods’ package (Nelson 2015) in R Fitting GLM model Green, P. , and Mac. Leod, C. J. 2016. SIMR: an R package for power analysis of generalized linear mixed models by simulation. Methods in Ecology and Evolution. 7: 493 -498 Setting a changing rate Adjusting sample size
Acknowledgement Field and laboratory work Financial support The Raquette River Advisory Council The Wild Center And more and more…