Using the Operations Dashboard for Arc GIS Jay

Using the Operations Dashboard for Arc. GIS Jay Chen / Tif Pun

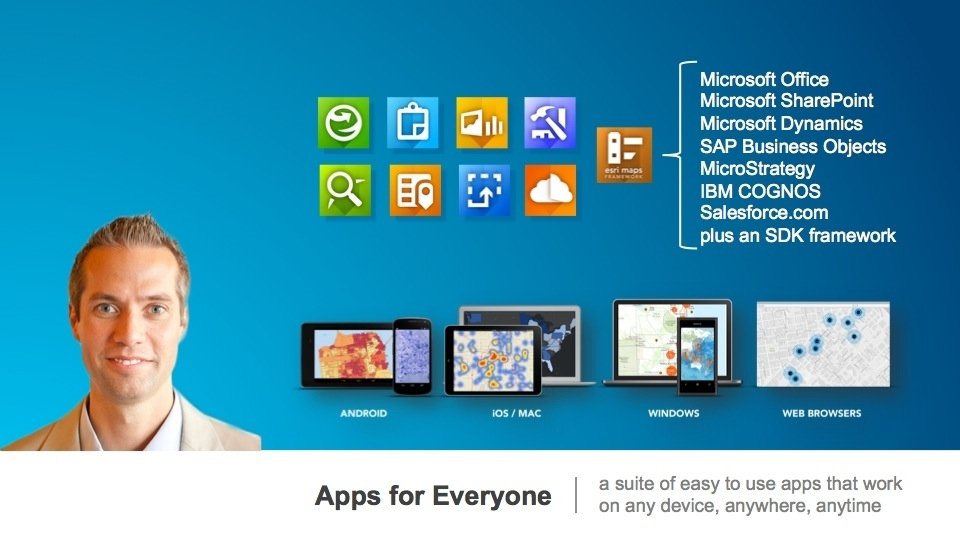
Overview of Esri’s App Strategy Agenda Using an Operation View Building an Operation View What’s Next for Operations Dashboard Questions
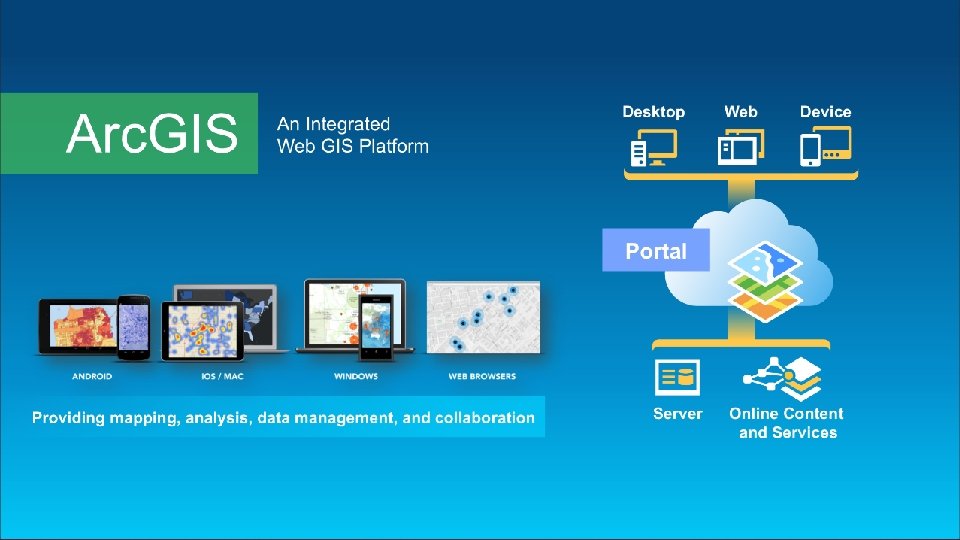

Operations Dashboard for Arc. GIS • 30, 000 feet overview - Monitor day to day operations - Manage planned and unplanned events Create and Share Views - Visualize key performance indicators • Ready to use widgets anyone can configure - Maps, Legend, - Bar Charts, Pie Charts, Histograms - Indicators, Gauges - Lists, Feature Details • Various map tools and feature actions - Interact with the map (e. g. set layer visibility) Laptops Tablets - Perform actions on features (e. g. follow a moving truck) • Extensible using Arc. GIS API for Java. Script - Code it once, use in Windows and browser platforms Ops Center

Customer Examples US Army Corps of Engineers, Texas City of Boston Ironman World Championships

Supported Platforms • Use it with Arc. GIS Online or Portal for Arc. GIS • Operations Dashboard running on Windows - Click. Once deployment through Arc. GIS Online or Portal for Arc. GIS - It’s both an authoring and viewing app - Supports multiple-display and single-display view - Requires named user account • Operations Dashboard running in browser - It’s a viewer! - No deployment needed, only requires a browser! - Supports single-display view - Supports anonymous access

Demo Use the Operations Dashboard
,")
Working with Real-time Data • Many sources of real-time data include: - Vessels (AIS), Vehicles (AVL) - SCADA - Weather - People - Social Media • Arc. GIS Server – Geo. Event Processor Extension • Challenges - How do I connect it to my apps? - How can I process/analyze it? - How do I make it available to others?

Creating and Using Operation Views Components • Widgets • Map Tools • Feature Actions • Data Sources Dynamic, Role Based Access Two Types of Views • Single Display • Multiple Display • Widgets are dynamic, interactive • Maps provide spatial context • Create and Share Focused views…

Composition of an Operation View… Map Tools Data Sources Feature Actions Widgets

Demo Create and Share Operation Views

Settings in the webmap used by the demo operation view

Road ahead • Allow Portal for Arc. GIS users to extend the app using the Arc. GIS API for Java. Script • Rebuild the app using Arc. GIS API for Java. Script • - Stream layer support - Smart mapping support - Support of 3 D Related table What do you want to see? ?

Upcoming Sessions for Operations Dashboard • • WEDNESDAY - 10: 30 am – Demo Theater 10 – Extend Operations Dashboard with Custom Widgets - 2: 30 pm – Demo Theater 10 – Operations Dashboard: An Introduction - 3: 15 pm – Room 32 B – Extending Operations Dashboard (Tech Workshop) THURSDAY - 3: 15 pm – Room 32 A – Using Operations Dashboard (Tech Workshop)

Thank you… • Please fill out the session survey in your mobile app • Select Using the Operations Dashboard for Arc. GIS in the Mobile App - Use the Search Feature to quickly find this title • Click “Technical Workshop Survey” • Answer a few short questions and enter any comments

Thank You! http: //doc. arcgis. com/en/operations-dashboard/ http: //forums. arcgis. com/ http: //ideas. arcgis. com/

- Slides: 18