Using STAAR data to guide learning August 20


 Well Prepared (Advanced Performance) Sufficiently Prepared Goal for")


 Item difficulty 100 90 Percentage")


- Slides: 61
Using STAAR data to guide learning August 20, 2014 District Professional Learning Session #174 1
Intended outcomes • Understand the use of thresholds to set student goals and monitor growth • Identify critical TEKS to serve as the focus for learning improvement for students and teachers • Model a process for performing an item analysis of STAAR and other assessment results 2
lead 4 ward resources • http: //lead 4 ward. com/resources/ – Released tests and snapshots tab • • • Process standards – Tools to know, ways to show Released tests - items organized by SE STAAR Snapshots – readiness, supporting and process SEs TEKS Snapshots – Aligned SEs in non-tested grades TEKS Scaffolding – SEs supporting tested readiness standards from current and prior grade levels 3
lead 4 ward resources • http: //lead 4 ward. com/STAARIntervention/ • PW: STAAR-Ready – Original ppt presentation – Original handout 4
But first. . . 5
Understand the use of thresholds to set student goals and monitor growth OBJECTIVE 1 6
STAAR Performance Standards Satisfactory Level I Unsatisfactory Performance “Inadequately Prepared” Level II Advanced Satisfactory Performance “Sufficiently Prepared” Level III Advanced Performance “Well Prepared”
Performance Standards and the Phase-in of STAAR Recommended 2016? Phase 2 2015? Phase 1 2011 -12 2012 -13 2013 -14
STAAR Performance Standards Satisfactory Level I Unsatisfactory Performance “Inadequately Prepared” Level II Advanced Satisfactory Performance “Sufficiently Prepared” P 1 P 2 Final Level III Advanced Performance “Well Prepared”
1 What score is needed to pass grade 5 math in 2015?
Psychometric Aside: Test equating Performance standard = 1489 scale score points (1489 “units” of math knowledge & skill) 2014 27 items 1489 11
Psychometric Aside: Test equating Performance standard = 1489 scale score points (1489 “units” of math knowledge & skill) 2015 28 items 1489 Items are less difficult 12
Psychometric Aside: Test equating Performance standard = 1489 scale score points (1489 “units” of math knowledge & skill) 2015 26 items 1489 Items are more difficult 13
1 ≈ 55% ≈ 65% ≈ 75% Think state, act local ≈ 85%
3 Really Well Prepared (Exceed Progress) Well Prepared (Advanced Performance) Sufficiently Prepared Goal for highest performing students (2 points Index 2) Meeting Level III Performance (Index 2 and Index 3) (Gr. 3 -8 Level II Final) Likely to pass STAAR at final standard (Index 4) Sufficiently Prepared Likely to pass STAAR this year (Level II Phase 2) Getting There Knows more than half the content OR Knows most but can’t apply
Let’s PLAY Fact or Fib S H O W D O W N
Fact Fib 1 = Fact; 2 = Fib t c All students can exceed progress and earn 2 points for your campus in Index 2 a F
Index 2: Student progress Grade 3 Math Level III Level II Final Grade 4 Math 148 pts 70 pts 1529 <70 pts 1677 Top performing students receive 2 pts (0 -2 incorrect) Exceeded Progress 2 points for campus 1599 Met Progress 1 point for campus Did Not Meet Progress 0 points for campus Level I Students in guessing range earn 0 points
Student progress with thresholds Grade 3 Math Grade 4 Math 85% Level III Level II Final 75% Level I 75% or more <75% 95% Exceeded Progress Met Progress p U g evelin L Progress Did Not Meet
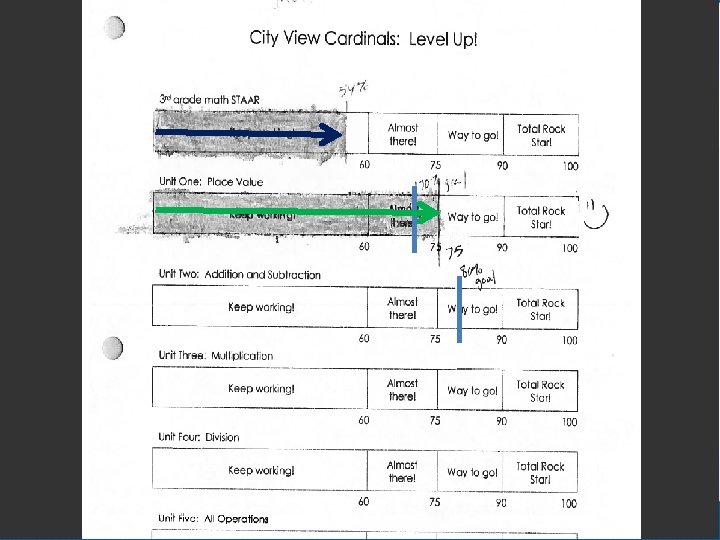
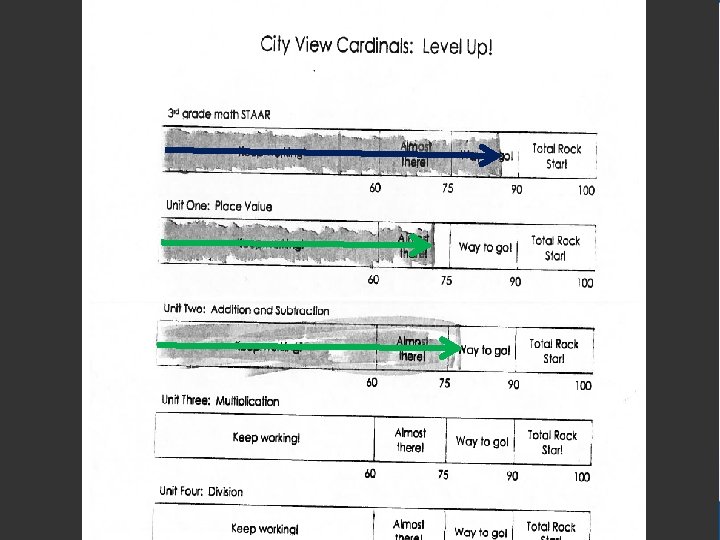
THRESHOLDS STAAR 2014 Goal for 2015 Leveling Up 3
Met Progress What do they all have in common? 5
Exceeded Progress What do they have in common?
Exceeded Progress Well almost… but…
Did NOT Meet Progress
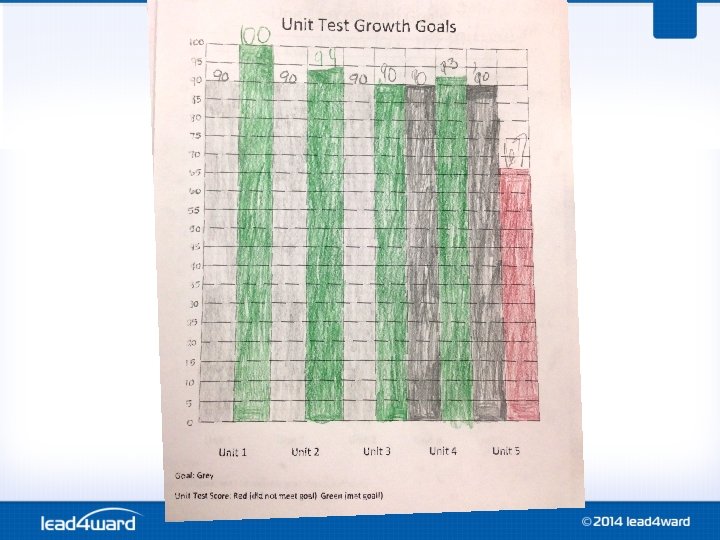
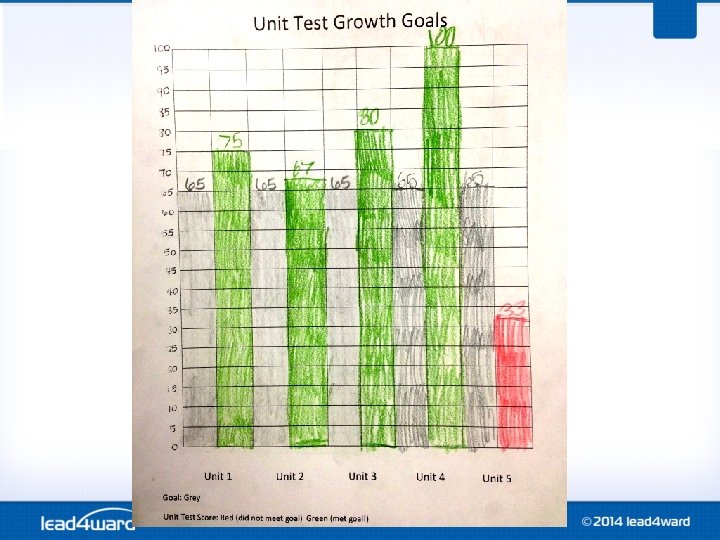
STAAR Should Ava have the same Local Assessment performance goals as Michael? Leveling Up Unit 1 Unit 2 5
Identify critical TEKS to serve as the focus for learning improvement for students and teachers OBJECTIVE 2 30
Using Heat Maps FOCUS How did we do?
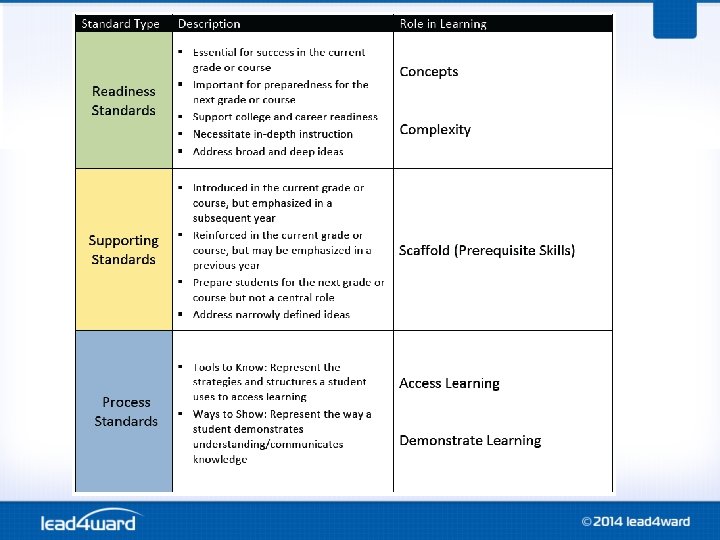
Start with what we are helping kids learn…the TEKS Readiness Supporting Process
Readiness Standards ≈ 30% of assessed TEKS ≈ 65% of STAAR Concepts BROAD and DEEP ideas IN-DEPTH instruction 9 Complexity 34
Benchmark Test 1 + 1= 9
Identifying focus standards • Compare 2013 STAAR to 2014 STAAR • Classify readiness and process standards – Increase/decrease of more than 5 points – Greater than/less than campus target • Identify areas of strength and concern • Select standards for teacher learning and student growth • Most customarily an August activity 38
Subtract How? Map Select Commit
Things we will need • 2013 and 2014 STAAR results, analysis by content and process SEs – Aware Heat Maps – District produced item analysis • Performance analysis sheet • Mapping standards sheet 40
Let’s try it together 41
For Teachers Learn the Low 6. 1 B 6. 2 B 6. 5 A Not so positive For Students Engage the Emerging 6. 2 C 6. 3 C 6. 6 C 6. 10 D 6. 8 B 6. 2 E 6. 4 A All of us helped more kids OR One of us figured it out! Positive outcomes p. 40 16
For Teachers Learn the Low What might teachers want to learn?
Select 3 Focus SEs
For Teachers Learn the Low 6. 1 B 6. 2 B 6. 5 A Pick 3 Not so positive For Students Engage the Emerging 6. 2 C 6. 3 C 6. 6 C 6. 10 D 6. 8 B 6. 2 E 6. 4 A Pick 3 Positive outcomes p. 40 16
Subtract Map Select Commit
6. 4 A 6. 5 A 6. 8 B 4 1 3 6 12 5 2 11 14 6. 2 B 6. 6 C 6. 2 C Questions to consider • How have these standards been taught and assessed in the past? • What will need to be learned by teachers? • How will student tasks be modified this year to better p. 40 align with STAAR? 16
Process Standards Assessed in Context STAAR process standards are assessed with Readiness or Supporting Standards in the same question (i. e. double coded). q ≥ 75% questions in Math (Grades 3 -8) q ≥ 40% questions in Science ≈ 60% q ≥ 30% questions in Social Studies q Reading? ≈ 50% Fig. 19 ≈ 82% ≈ 55% 48
Process Standards… “Game Changers” OR IDENTIFY and EXPLAIN Potential Rigor… Cause/Effect Compare/Contrast Predict RIG 8. 5 (E) identify the foreign policies of presidents Washington through Monroe and explain the impact of Washington's Farewell Address and the Monroe Doctrine; Readiness Standard 8. 29 (B) analyze information by sequencing, categorizing, identifying cause-and-effect relationships, comparing, contrasting, finding the main idea, summarizing, making generalizations and predictions, and drawing inferences and conclusions;
Process Standards… “Game Changers” Which of the following foreign policies are best associated with Presidents Washington through Monroe? IDENTIFY and EXPLAIN Potential Rigor… Cause/Effect Compare/Contrast Predict RIGOR What issues are common in both Washington’s Farewell address and the Monroe doctrine?
Benchmark Test 1 + 1= 24
17 8 + 6 + 10 = 24
53
FOCUS! • Focus Readiness Standards – Linked Supporting Standards • Highly tested Process Standards
Considering your focus SEs • What goals will you set for student performance in these areas? • How will your PLCs work to increase understanding of readiness and process SEs? • What will you do differently this year when planning for learning and assessing for learning? • How will you help students understand the content, context and cognitive rigor of assessed SEs? • How will you ensure that students have ample experience with process standards? 55
Model a process for performing an item analysis of STAAR and other assessment results OBJECTIVE 3 56
Percentage Correct Item analysis Item Number 57
Item analysis 2014 STAAR - Grade 4 Math (district) Item difficulty 100 90 Percentage Correct 80 70 60 50 40 30 20 10 0 1 2 3 4 5 6 7 8 9 101112131415161718192021222324252627282930313233343536373839404142434445464748 Item Number 58
Item analysis 2014 STAAR - Grade 3 Math 100 BISD JCB 90 Item Difficulute (% correct) 80 70 60 50 40 30 20 10 0 1 3 5 7 9 11 13 15 17 19 21 23 25 Item Number 27 29 31 33 35 37 39 41 43 45 59
Item analysis process 1. Write standards assessed in margin 2. Write percentage for each answer choice 3. Circle correct answer – What must students know and be able to do to answer correctly? 4. What is content, context and cognitive rigor evident in the item and in the assessed standard(s)? 5. Inspect distractors – Is one distractor attractive to students? What errors in thinking may cause students to choose it? Are guessing patterns evident? Are differences in answering patterns evident by student group? 6. What types of prompts/graphics were used? Were they needed to answer correctly? If not, what prior knowledge and skills were needed? 62
Item analysis process 7. What academic or general vocabulary must be understood in order to answer correctly? With which terms would students most likely struggle? Were these same terms used as part of instruction? 8. Identify the most difficult items assessed. When these standards were taught, what tasks were students assigned to assist in their learning? How well were the tasks aligned with what students are expected to do on STAAR? 9. What changes in instruction will be considered based on the analysis? 63