Using Randomization Methods to Build Conceptual Understanding of

Using Randomization Methods to Build Conceptual Understanding of Statistical Inference: Day 2 Lock, Lock Morgan, Lock, and Lock MAA Minicourse- Joint Mathematics Meetings Baltimore, MD January 2014

Schedule: Day 2 Saturday, 1/18, 1: 00 – 3: 00 pm 5. More on Randomization Tests • How do we generate randomization distributions for various statistical tests? • How do we assess student understanding when using this approach? 6. Connecting Intervals and Tests 7. Connecting Simulation Methods to Traditional 8. Technology Options • Other software for simulatiions (Minitab, Fathom, R, Excel, . . . ) • Bascis summary stats/graphs with Stat. Key • A more advanced randmization with Stat. Key 9. Wrap-up • How has this worked in the classroom? • Participant comments and questions 10. Evaluations

Cocaine Addiction • In a randomized experiment on treating cocaine addiction, 48 people were randomly assigned to take either Desipramine (a new drug), or Lithium (an existing drug) • The outcome variable is whether or not a patient relapsed • Is there convincing evidence to conclude that Desipramine is better than Lithium at treating cocaine addiction?

R R R R R R R R R R R R 1. Randomly assign units to treatment groups Desipramine R R Lithium R R R R R R R R R R

2. Observe relapse counts in each group 3. Compare the proportions who relapse R = Relapse N = No Relapse 1. Randomly assign units to treatment groups Desipramine Lithium R R R R N R R R R N R N N R R R N N N 10 relapse, 14 no relapse 18 relapse, 6 no relapse Is this convincing evidence?

Randomization Test • Assume the null hypothesis is true • Simulate new randomizations • For each, calculate the statistic of interest • Find the proportion of these simulated statistics that are as extreme as your observed statistic

R R R R N N R R R N N N N 10 relapse, 14 no relapse 18 relapse, 6 no relapse

R R R R N N R R R N N N N Simulate another randomization Desipramine R N Lithium N N N R R R R N N N R R R N N N R R R R 16 relapse, 8 no relapse 12 relapse, 12 no relapse

Simulate another randomization Desipramine Lithium R R R R N R R N N R R R R N R N R R N N N 17 relapse, 7 no relapse 11 relapse, 13 no relapse

Physical Simulation

Cocaine Addiction A randomization sample must: • Use the data that we have (That’s why we didn’t change any of the results on the cards) AND • Match the null hypothesis (That’s why we assumed the drug didn’t matter and combined the cards)

Stat. Key Distribution of Statistic Assuming Null is True Proportion as extreme as observed statistic The probability of getting results as extreme or more extreme than those observed if the null hypothesis is true, is about. 02. p-value

How can we do a randomization test for a correlation?

Is the number of penalties given to an NFL team positively correlated with the “malevolence” of the team’s uniforms?

Ex: NFL uniform “malevolence” vs. Penalty yards r = 0. 430 n = 28 Is there evidence that the population correlation is positive?
 consistent with the null hypothesis (b) based")
Key idea: Generate samples that are (a) consistent with the null hypothesis (b) based on the sample data. H 0 : = 0 r = 0. 43, n = 28 How can we use the sample data, but ensure that the correlation is zero?

Randomization by Scrambling

Randomize one of the variables! Let’s look at Stat. Key.

Traditional Inference 1. Which formula? 4. Which theoretical distribution? 5. df? 6. find pvalue 2. Calculate numbers and plug into formula 3. Plug into calculator 0. 01 < p-value < 0. 02

How can we do a randomization test for a mean?

Example: Mean Body Temperature Is the average body temperature really 98. 6 o. F? H 0: μ=98. 6 Ha: μ≠ 98. 6 Data: A random sample of n=50 body temperatures. Data from Allen Shoemaker, 1996 JSE data set article
 consistent with the null hypothesis (b) based")
Key idea: Generate samples that are (a) consistent with the null hypothesis (b) based on the sample data. How to simulate samples of body temperatures to be consistent with H 0: μ=98. 6?

Randomization Samples How to simulate samples of body temperatures to be consistent with H 0: μ=98. 6?

Let’s try it on Stat. Key.

Playing with Stat. Key! See the orange pages in the folder.

Choosing a Randomization Method Example: Word recall A=Sleep 14 18 11 13 18 17 21 9 16 17 14 15 mean=15. 25 B=Caffeine 12 12 14 13 6 18 14 16 10 7 15 10 mean=12. 25 H 0: μA=μB vs. Ha: μA≠μB Reallocate Option 1: Randomly scramble the A and B labels and assign to the 24 word recalls. Resample Option 2: Combine the 24 values, then sample (with replacement) 12 values for Group A and 12 values for Group B.

How do we assess student understanding of these methods (even on in-class exams without computers)? See the blue pages in the folder.

Connecting CI’s and Tests Randomization body temp means when μ=98. 6 Bootstrap body temp means from the original sample What’s the difference?

Fathom Demo: Test & CI Sample mean is in the “rejection region” Null mean is outside the confidence interval

What about Traditional Methods?

Transitioning to Traditional Inference AFTER students have seen lots of bootstrap distributions and randomization distributions… Students should be able to • Find, interpret, and understand a confidence interval • Find, interpret, and understand a p-value

Bootstrap and Randomization Distributions Correlation: Malevolent uniforms Slope : Restaurant tips All bell-shaped What do you Diff means: Finger taps distributions! notice? Mean : Body Temperatures Proportion : Owners/dogs Mean : Atlanta commutes

The students are primed and ready to learn about the normal distribution!
 • Introduce")
Transitioning to Traditional Inference • Introduce the normal distribution (and later t) • Introduce “shortcuts” for estimating SE for proportions, means, differences, slope…

Confidence Intervals 95% -z* z*

Hypothesis Tests 95% Test statistic Area is p-value

Yes! Students see the general pattern and not just individual formulas!

Other Technology Options Your binder includes information for doing several simulation examples using • Minitab (macros) • R (defined functions) • Excel (Pop. Tools ad-in) • Fathom (drag/drop/menus) • Matlab (commands) • SAS (commands)

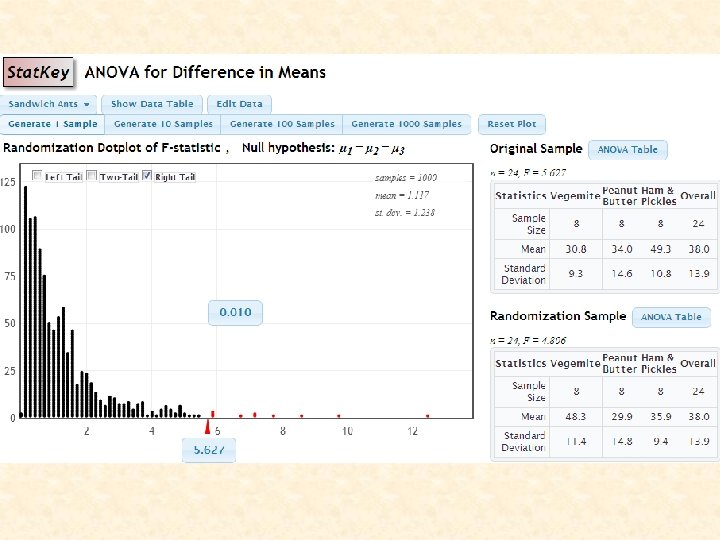
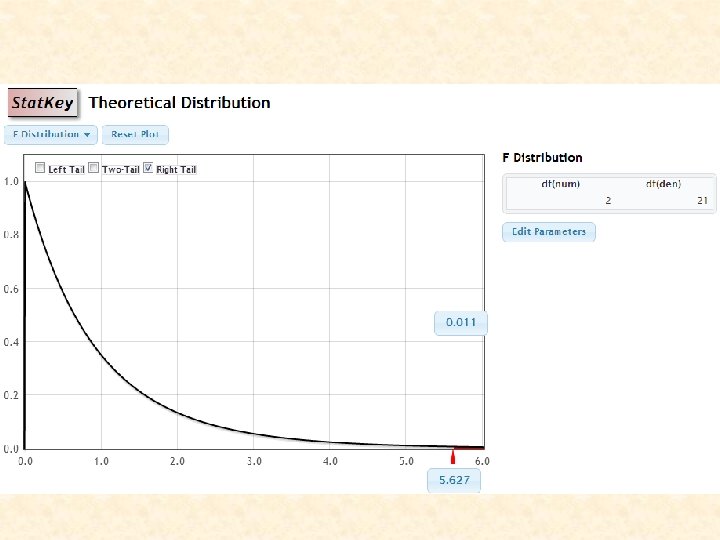
More Stat. Key Basic Statistics/Graphics

Sampling Distribution Capture Rate

Example: Sandwich Ants Experiment: Place pieces of sandwich on the ground, count how many ants are attracted. Does it depend on filing? Favourite Experiments: An Addendum to What is the Use of Experiments Conducted by Statistics Students? Margaret Mackisack http: //www. amstat. org/publications/jse/v 2 n 1/mackisack. supp. html

Student Preferences Which way of doing inference gave you a better conceptual understanding of confidence intervals and hypothesis tests? Bootstrapping and Randomization 113 69% Formulas and Theoretical Distributions 51 31%

Student Preferences Which way did you prefer to learn inference (confidence intervals and hypothesis tests)? Bootstrapping and Randomization 105 64% Formulas and Theoretical Distributions 60 36% Simulation Traditional AP Stat 31 36 No AP Stat 74 24

Student Behavior • Students were given data on the second midterm and asked to compute a confidence interval for the mean • How they created the interval: Bootstrapping 94 84% t. test in R Formula 9 8%

A Student Comment " I took AP Stat in high school and I got a 5. It was mainly all equations, and I had no idea of theory behind any of what I was doing. Statkey and bootstrapping really made me understand the concepts I was learning, as opposed to just being able to just spit them out on an exam. ” - one of Kari’s students

Thank you for joining us! More information is available on www. lock 5 stat. com Feel free to contact any of us with any comments or questions.
- Slides: 48