Using Probes in Science Instruction Gary Carlin CFN

Using Probes in Science Instruction Gary Carlin, CFN 603 917 -714 -7448 gcarlin@schools. nyc. gov

Probes

Introductory Activity: Why Probes?

* * * Probes * * * • Brief, easily administered measures. • Samples the entire range of skills that the student must learn by the end of the year. • Indicates if the students are learning at a pace that will allow him/her to meet their annual learning goals

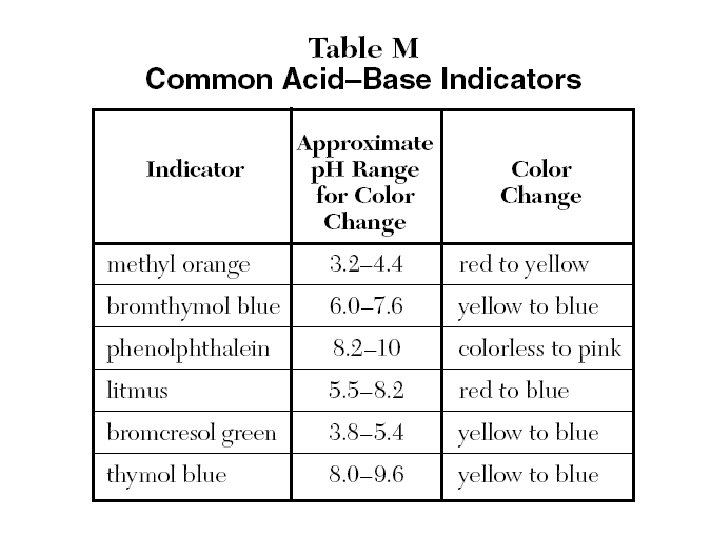
Chemistry • 48 Which indicator would best distinguish between a solution with a p. H of 3. 5 and a solution with a p. H of 5. 5? • (1) bromthymol blue (3) litmus • (2) bromcresol green (4) thymol blue

Probes • Brief, easily administered measures. • Samples the entire range of skills that the student must learn by the end of the year, rather than just the particular skills a teacher may be teaching that week or month. • Indicate if the student is learning at a pace that will him/her to meet annual learning goals.

Continuous Assessment “It is estimated that continuous assessment systems generate 50 times more information that periodic and larger scale systems combined. ”

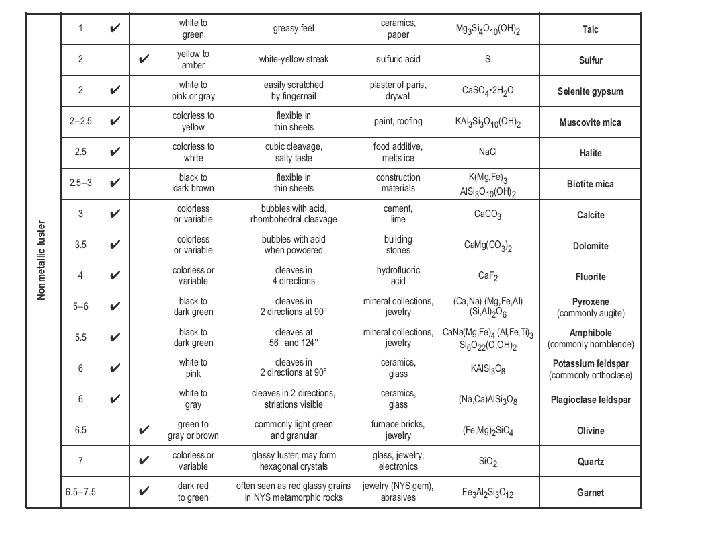
Earth Science 34 The table below shows some properties of four different minerals. The minerals listed in the table are varieties of which mineral? (1) garnet (3) quartz (2) magnetite (4) olivine
")
9 By which process do plants add water vapor to the atmosphere? • (1) precipitation (3) condensation • (2) transpiration (4) absorption

• 30 The diagram below shows the index minerals of Mohs hardness scale compared with the hardness of some common objects. • Which statement is best supported by the diagram? • (1) A fingernail will scratch calcite but not gypsum. • (2) Calcite will be scratched by a copper penny. • (3) The mineral apatite will scratch topaz. • (4) A steel file has a hardness of about 7. 5.

• 25 The symbols below are used to represent different regions of space. • Which diagram shows the correct relationship between these four regions? [If one symbol is within another symbol, that means it is part of, or included in, that symbol. ]

• 30 The data table below shows the mass and volume of three samples of the same mineral. [The density column is provided for student use. ] • • Which graph best represents the relationship between the density and the volume of these mineral samples?

Living Environment 51 The human female reproductive system is represented in the diagram. Complete boxes 1 through 4 in the chart below using the information from the diagram. [4]

8 th Grade

• 22 The relationship of some mammals is indicated in the diagram below. • Which statement about the African elephant is correct? • (1) It is more closely related to the mammoth than it is to the West African manatee. • (2) It is more closely related to the West Indian manatee than it is to the mastodon. • (3) It is not related to the Brazilian manatee or the mammoth. • (4) It is the ancestor of Steller’s sea cow.
 and ecosystems")
• 29 Which diagram best illustrates the relationship between humans (H) and ecosystems (E)?

• 32 Information concerning the diet of crocodiles of different sizes is contained in the table below. • Percentage of Crocodiles of Different Lengths and Their Food Sources • Which statement is not a valid conclusion based on the data? • • (1) Overharvesting of fish could have a negative impact on group C. (2) The smaller the crocodile is, the larger the prey. (3) Group B has no preference between reptiles and birds. (4) Spraying insecticides would have the most direct impact on group A.

• 31 The graph below shows the effect of moisture on the number of trees per acre of five tree species. Which observation best represents information shown in the graph? • • (1) All five species grow in the same habitat. (2) The American elm grows in the widest range of moisture conditions. (3) Red oaks can grow in wetter conditions than black willows. (4) Sugar maples can grow anywhere black oaks can grow.
 a cormorant (3)")
ILSA • 8 Bird B is correctly identified as • (1) a cormorant (3) an eagle • (2) a duck (4) a jacana

• Some species of bacteria are harmful. Antibiotics are chemicals that kill bacteria. Some bacteria are resistant to antibiotics and are not killed by these chemicals. Over time, the resistant bacteria can reproduce and create populations that are not affected by antibiotics. The graphs below show the results of a controlled experiment that measured the population of one species of bacteria that had been grown in four containers under identical conditions. Different antibiotics were added to three of the four containers. • 43 Which conclusion about this species of bacteria is best supported by the information in the graphs? (1) Antibiotic A continuously slowed the growth. (2) Antibiotic B was least effective in controlling the growth. (3) Antibiotic C was most effective in controlling the growth. (4) Antibiotics A and B slowed the growth. • •
 At")
• 45 Which statement is supported by the graph? • • (1) At age 9, a female needs the same daily Calories as a male. (2) At age 14, a female needs more daily Calories than a male. (3) An 11 -year-old child needs twice as many daily Calories as a 6 -year-old child. (4) An 8 -year-old female needs fewer daily Calories than a 5 -year-old male.

• The only years shown in which Halley’s Comet could be viewed from Earth without the use of a telescope were 1910 and 1986. What is the next year in which Halley’s Comet will be visible from the Earth without the use of a telescope? • (1) 2010 • (2) 2062 (3) 2086 (4) 2110
- Slides: 24