Using Open Data to investigate private entities Roxanne


 is limited, corruption occurs. •")
 has a separate")


 points")
- Slides: 22
Using Open Data to investigate private entities
Roxanne Joseph Data Journalist roxanne@openup. org. za @rox_jos
"Numbers have an important story to tell. They rely on you to give them a clear and convincing voice. " - Stephen Few, Perceptual Edge
Data Journalism is a difficult term to define since there are: > different perspectives around it and > a number of ways to approach it What is data journalism? Answer: Data Journalism is journalism based on or supported by data. In other words data journalism is when data drives the story. i. e. Data-driven journalism
What about data itself? How would you describe data? Answer: Everything we see is recorded and converted into what we call data. Our height; our age; the number of modes of transport we take to work everyday; the number of children able to attend school and the number that aren’t able to. This data when it is displayed in the right format and the right grouping (known as a cluster and more familiarly described as a dataset), can lead us to exclusive, impactful and unique stories: Scoop. It’s important to understand here that data is not restricted to numerical values. Data can also come in the form of audio files, photographs, videos and documents amongst others. Data Journalism is supported by Open Data and Open Government initiatives and there are many websites with an abundance of datasets yet to be explored by journalists.
Why is data journalism important & relevant? While there are plenty of stories hidden within datasets, the only way you as a journalist have the ability to uncover them, is through the practice of Data Journalism. As a data journalist, you are will become familiar with the term “interviewing the data” This happens after you’ve sourced the data. You will need to process and clean the data, format the data, analyse the data - basically work with the data Don't lose the storytelling! In bringing data into your story, there can be a tendency to lose the human aspect, the relevance to the community and/or the human emotion that ties into the story. The fundamentals of journalism do not change. Ensure your story has a human face and interesting characters, the numbers are not enough.
Open Data and corporate data • When information (availability) is limited, corruption occurs. • Transparency and accountability need a global shift towards openness. • Corporate data can be essential in combating corruption, and many companies are becoming more transparent. But many are not. • Registries generally only collect scant information on the finances and actual operations of private companies. Such secrecy allows them to evade government regulation and public scrutiny; it facilitates corruption, tax evasion and other corporate crimes.
What is a private entity? • A Private Company (Pty limited) has a separate life from its owners and is required by the The Companies Act, No 71 of 2008 to perform rights and duties of its own • It has legal personality, so has rights, duties and capabilities. • This type of business structure in South Africa does not place any prohibition on foreign shareholding and only requires one shareholder and one director. • A private entity is given legal personality by the state for the good of society.
Cracking private companies • Private companies are often not covered on as regular a cycle as publicly traded companies as they don’t have regular financial filings that often lead to stories. • This means that journalists often miss out on stories that are in the public’s interest to know. • Read through the news, look through public records and then go to the company to help you fill in the blanks. • Different people within a company have different types of information. You should also look beyond the company itself, to former employees, competitors, vendors and suppliers.
• Use the company’s own records as a voice in the story: Companies have an image to protect and often they work hard to show a particular face to the public; this is why their annual reports are gold. • Figuring out where private companies intersect with public information is key to thorough, expert coverage of said companies. This is why you should know what type of information private companies are required to disclose, and to whom. A few places to look • • Health and safety Patent information Environmental information Donations Court information Executive information Tax information
The closed world of corporate data • We live in a corporate world, but much of it is invisible to us. Company records can now be found online, in the form of hundreds of records; and they exist as part of dozens of intricate networks. • Without data, there is no understanding of the corporate world and without understanding, there is no control. • • • OGP countries, including South Africa, are measured by 4 key elements, in order to determine their level of access to corporate data: • Data Basic search • Depth Licence
Where do we as journos begin? • Annual reports • Business description • Vision and mission statements of the company • Corporate information • Products overview and financial in the last 5 -10 years • Director’s report • Corporate governance • Shareholding • Financial statements • Public records Court records (not available online) Judgments (SAFLII) Government Gazettes (Open Gazettes South Africa) Tender bids and awards Company liquidation notices Liquor license applications Business and personal name changes • Sources
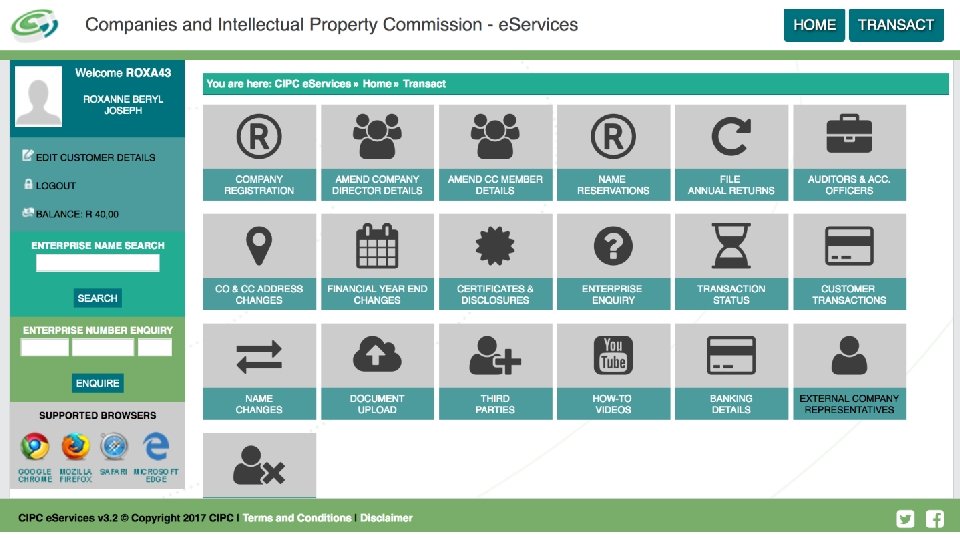
• Subscription databases • CIPC • Windeeds • Lexis. Nexis • Free searches • Open Corporates • Investigative Dashboard • The Corporate Intelligence Project • Who Owns Whom • Open. Ownership
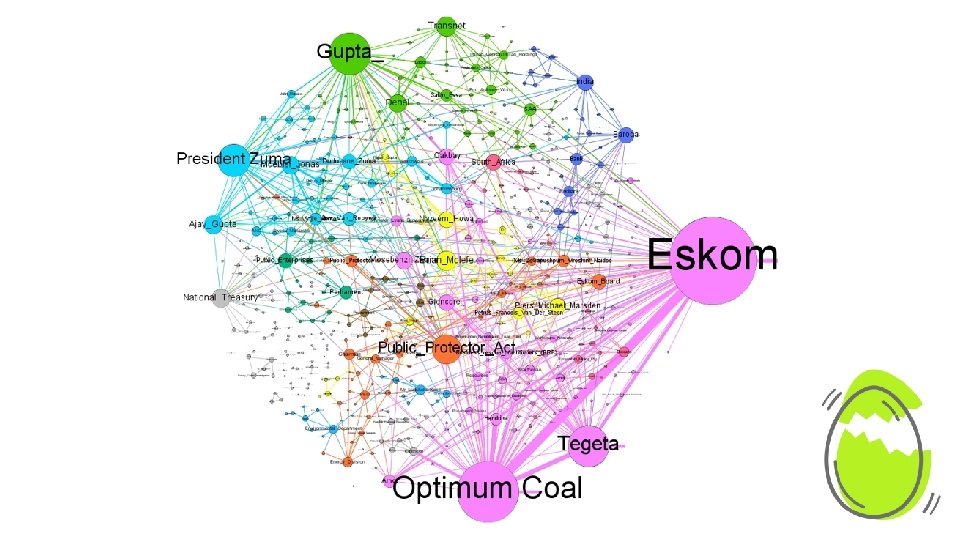
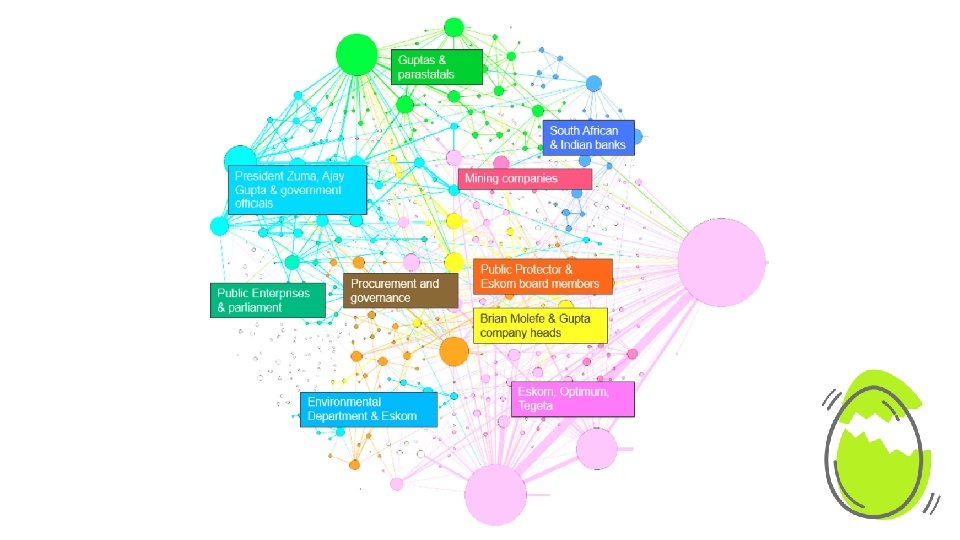
Visualising the data Analysis, presentation and visualisation Sometimes, there’s overlap between the tools that journalists use to analyse and visualise their story. Visual Investigative Scenarios: (VIS) a data visualization platform designed to assist investigative journalists, activists and others in mapping complex business or crime networks. Its aim is to help investigators understand explain corruption, organised crime and other wrongdoings and to translate complex narratives into simple, universal visual language.
Visualising the data Analysis, presentation and visualisation Carto: Carto is a platform used for turning location data into interactive maps, and although a little bit trickier than the previous resources, once you get the hang of it, is a fantastic tool for storytelling.
Visualising the data Analysis, presentation and visualisation Story. Map JS: Story. Map. JS is a free tool to help you tell stories on the web that highlight the locations of a series of events. It is a new tool, yet stable in our development environment, and it has a friendly authoring tool.
Visualising the data Analysis, presentation and visualisation Timeline JS: Timeline. JS is an open-source tool that enables anyone to build visually rich, interactive timelines. Beginners can create a timeline using nothing more than a Google spreadsheet.
Visualising the data Analysis, presentation and visualisation Tableau: If you don’t need the unlimited space of the professional edition, this is free and means you can make pretty complex visualisations simply and easily with up to 100, 000 rows. It’s best used when you need to bring different types of charts together, such as a map and a bar chart. You can also use it as a data explorer, which is a method used by all types of storytellers.
The State Capture Report (released by the former Public Protector in October 2016) points to a small group of highpowered individuals who control what is meant to be a constitutional democracy. The Guptas form part of that circle and as you’ve probably read over the past few weeks, there is now proof of this in the form of the #Gupta. Leaks – they show the family obtained business from government.