Using Microsoft Excel with Exploring Marketing Research By

Using Microsoft Excel with Exploring Marketing Research By William G. Zikmund

TITLE BAR MENU BAR STANDARD TOOLBAR FORMATTING TOOLBAR FORMULA BAR ACTIVE CELL

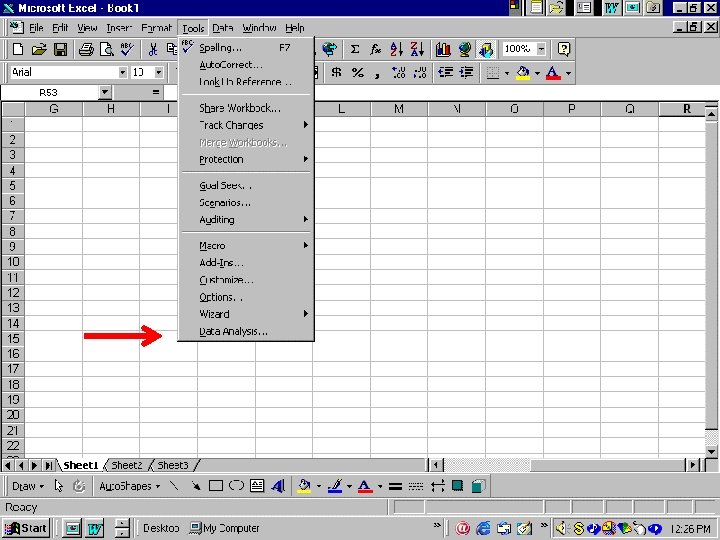
PASTE FUNCTION TOOLS MENU

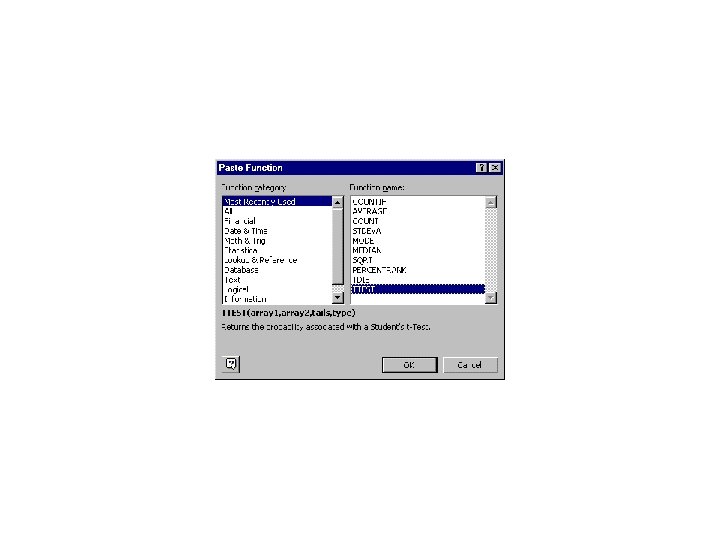
The Paste Function Provides Numerous Statistical Operations

The Statistical Function Category

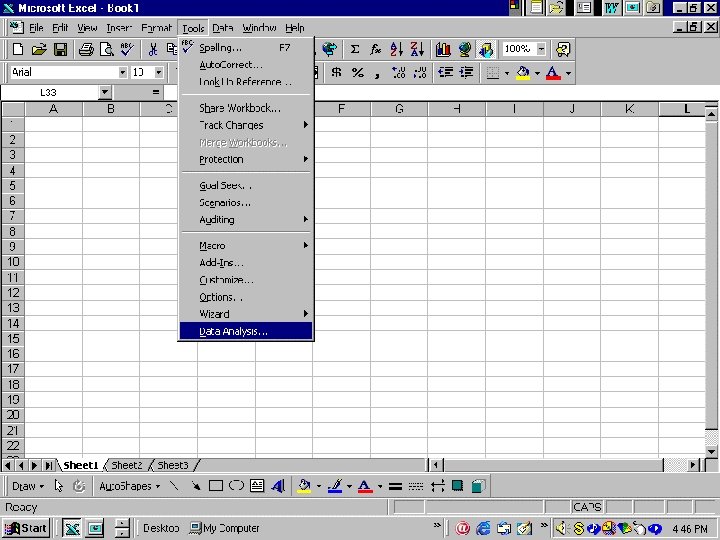
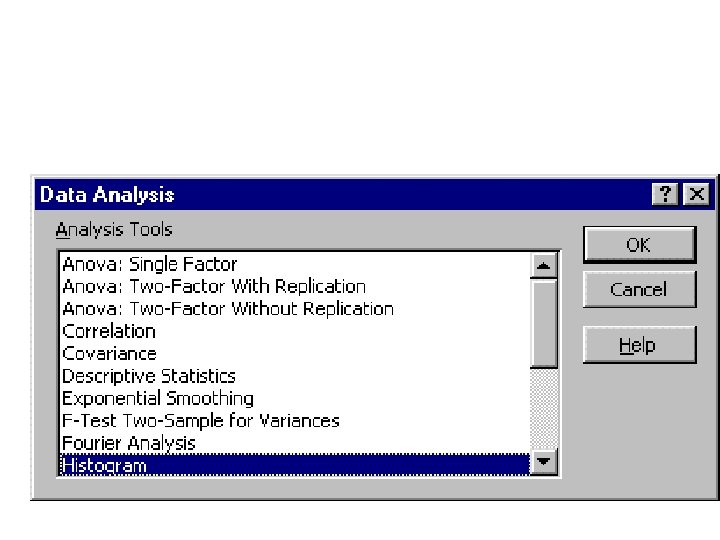
Data Analysis Dialog Box • Click on “Tools” • Select “Data Analysis” • Select statistical operation – such as Histogram

Functions • Functions are predefined formulas for mathematical operations • They perform calculations by using specific values, called arguments • Arguments indicate data or a range of cells • Arguments are performed, in a particular order, called the syntax.

Functions • Functions are predefined formulas for mathematical operations • They perform calculations by using specific values, called arguments • Arguments are performed, in a particular order, called the syntax. • For example, the SUM function adds values or ranges of cells
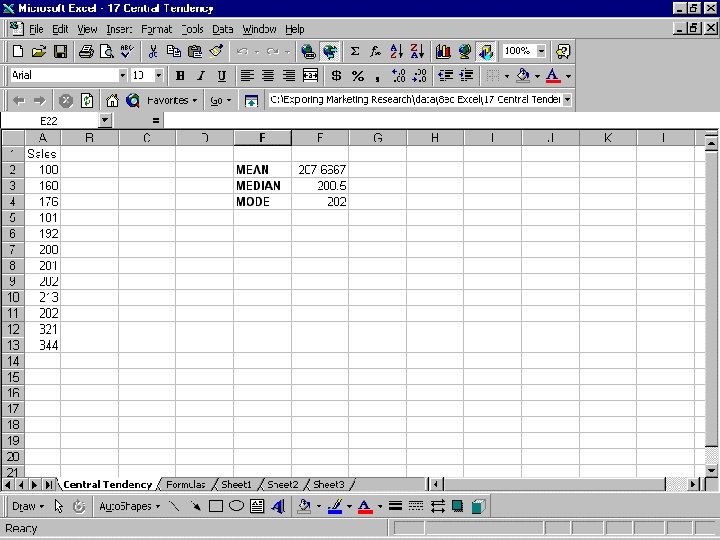
 MEDIAN MODE SUM STANDARD")
Easy to Use Paste Functions • • • AVERAGE (MEAN) MEDIAN MODE SUM STANDARD DEVIATION

Functions • The syntax of a function begins with the function name • followed by an opening parenthesis • the arguments for the function • separated by commas • a closing parenthesis. • If the function starts a formula, an equal sign (=) is typed before the function name.
 • =FUNCTION")
The Equal Sign The Function Name And Arguments • =FUNCTION (Argument 1) • =FUNCTION (Argument 1, Argument 2)

Arguments • Typical arguments are numbers, text, arrays, and cell references. • Arguments can also be constants, formulas, or other functions.

The AVERAGE Function Located in the Statistical Category
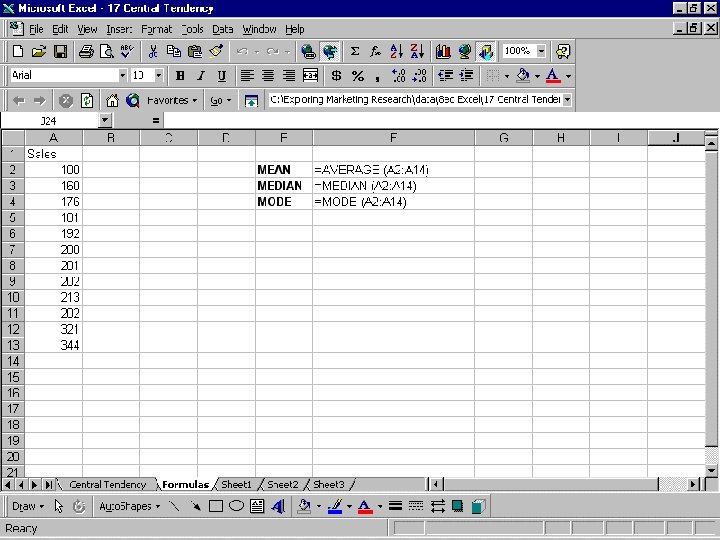

Data Array • • The data appear in cells A 2 through 14 A 2: A 14 Sometimes written with dollars signs $A$2: $A$14
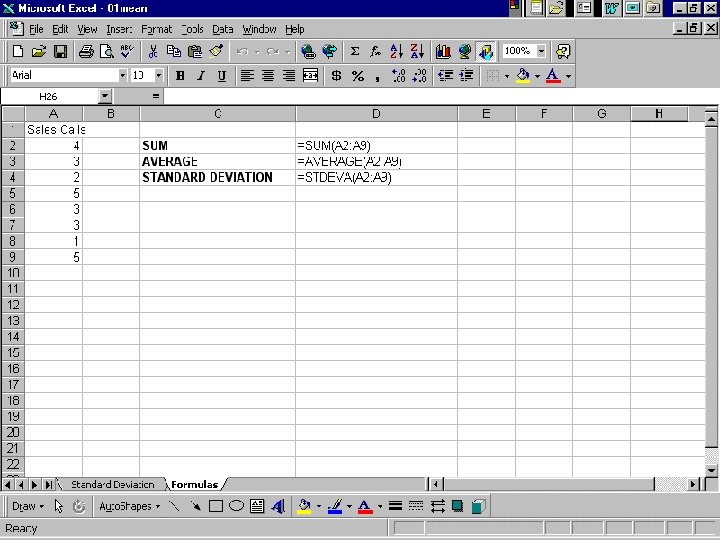
 =SUM(A 2: A 9)")
Sum, Average, and Standard Deviation • • =FUNCTION (Argument 1) =SUM(A 2: A 9) =AVERAGE(A 2: A 9) =STDEVA(A 2: A 9)
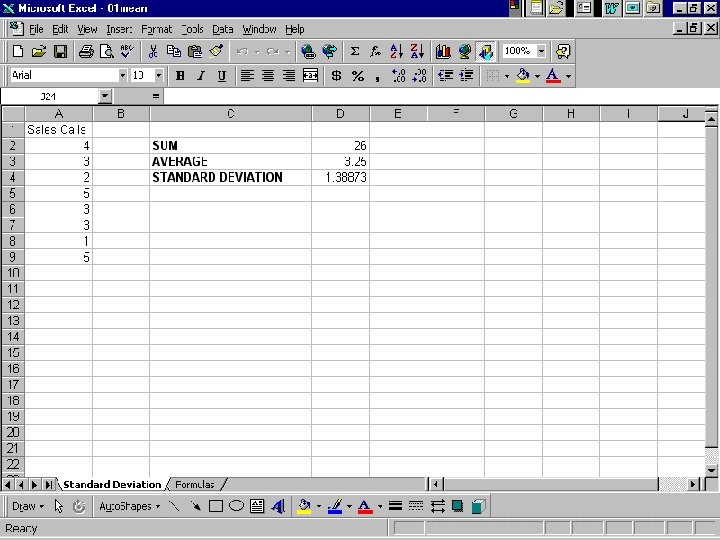

SUM Function Sales Call Example
 Function Sales Call Example")
AVERAGE (Mean) Function Sales Call Example

Standard Deviation Function Sales Call Example

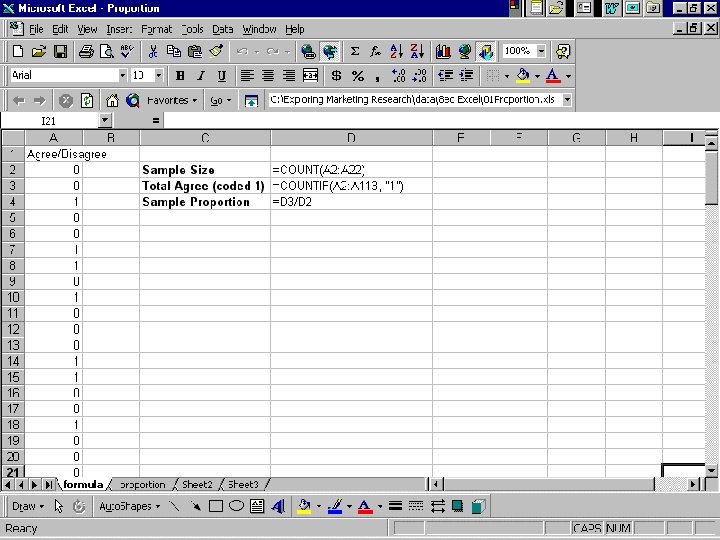
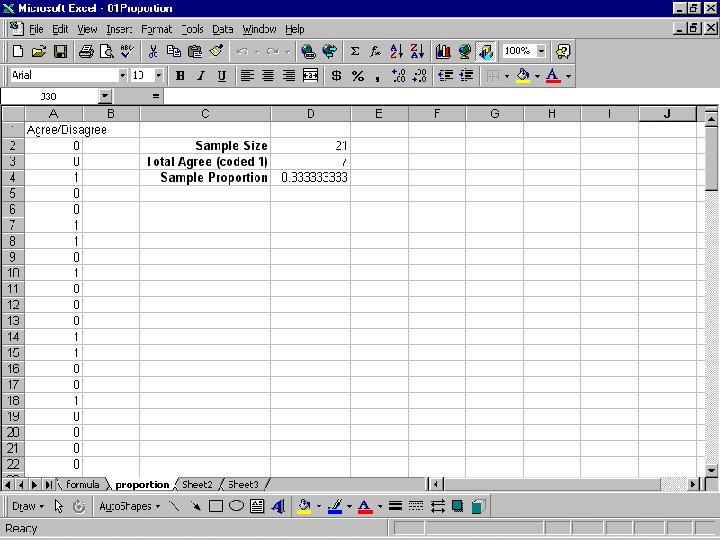
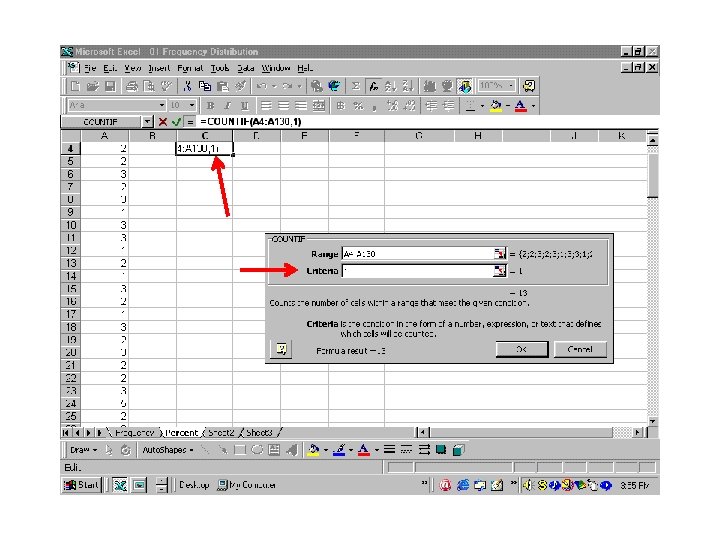
Proportion • • =COUNTIF DIVIDE COUNTIF BY COUNT =D 3/D 2

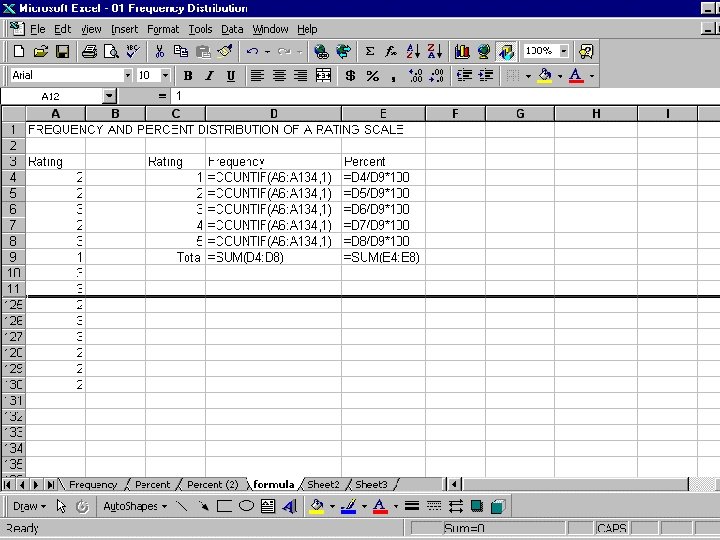
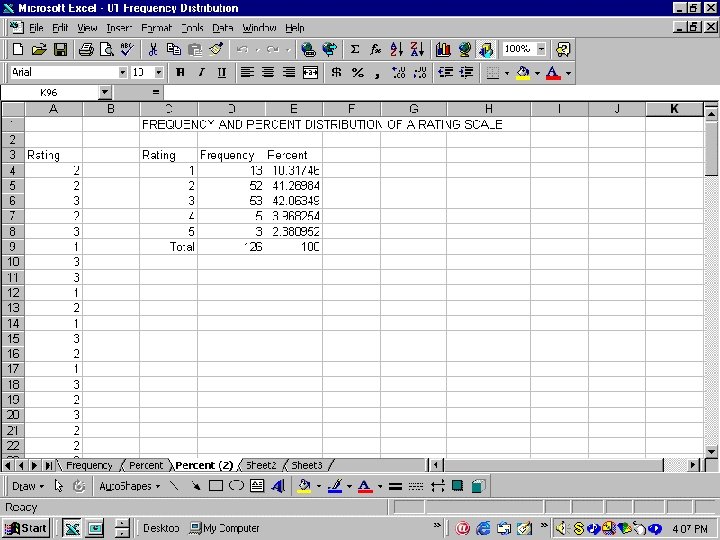
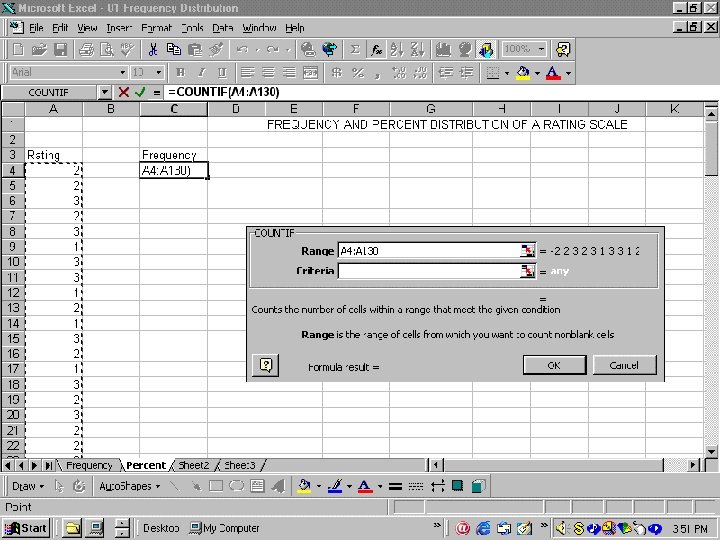
Frequency Distributions • There alternative ways of constructing frequency distributions • COUNTIF function • HISTOGRAM function
 =D 4/D 9*100")
=COUNTIF(A 6: A 134, 1) =D 4/D 9*100

Histogram Function • Tools -Data Analysis-Histogram • Bins
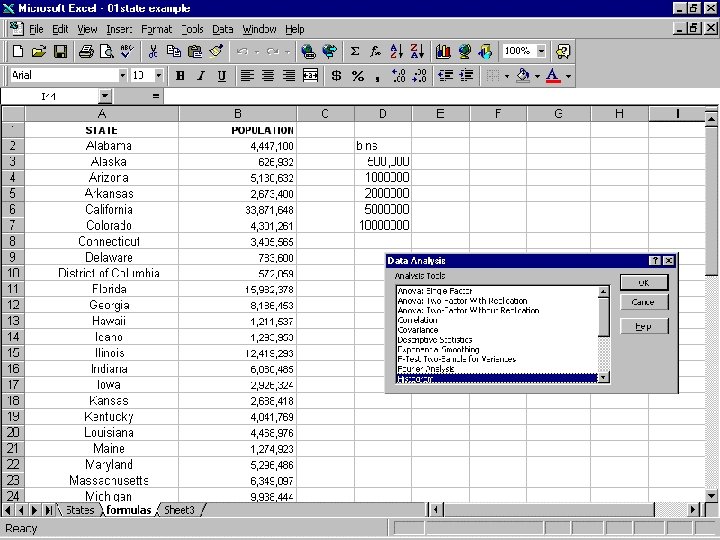

The bins are the frequency categories

Insert Input and Bin Ranges

Text Labels Can Be Included or Excluded From Input Range

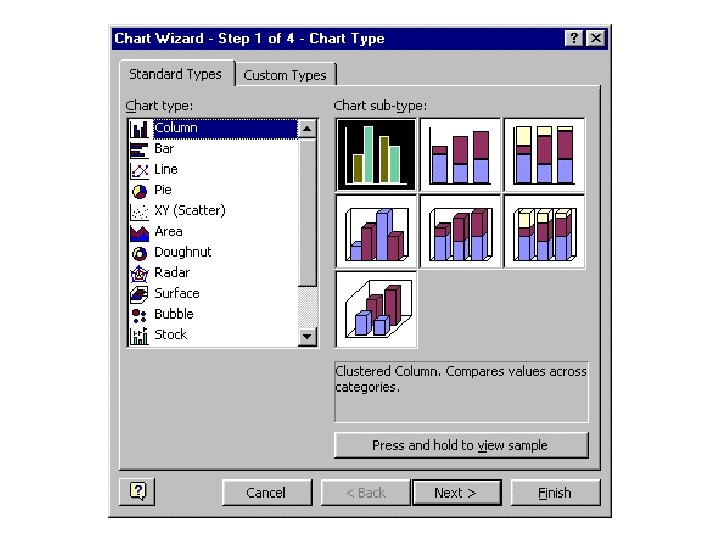
The Chart Wizard

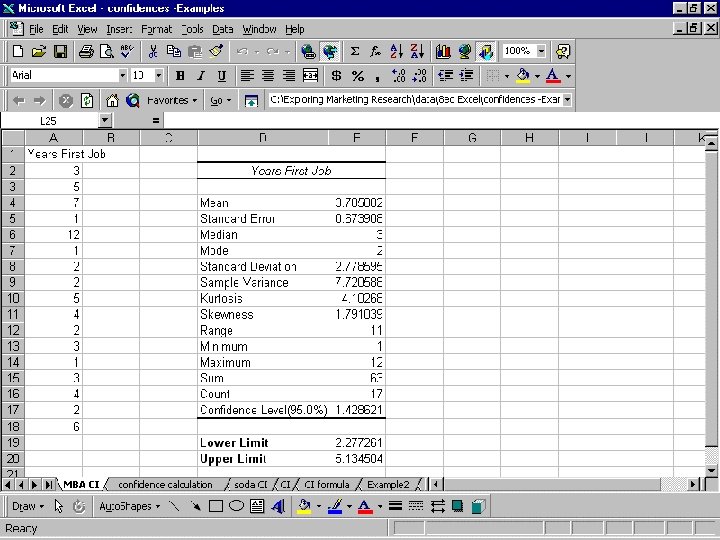
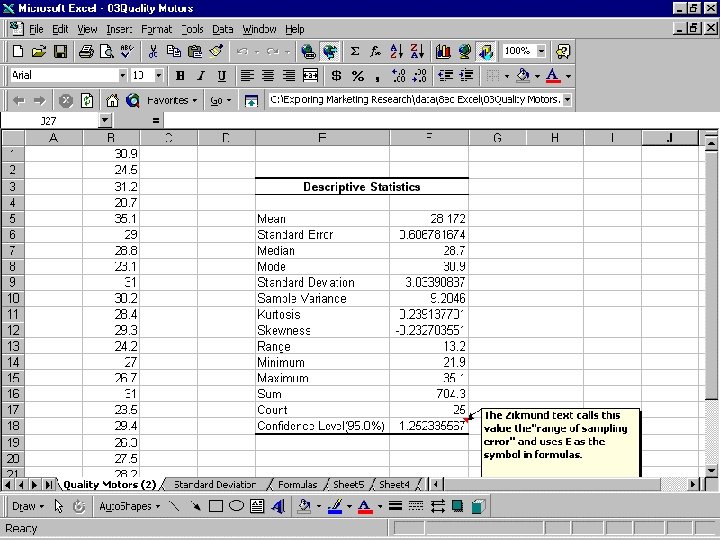
The Descriptive Statistics Function
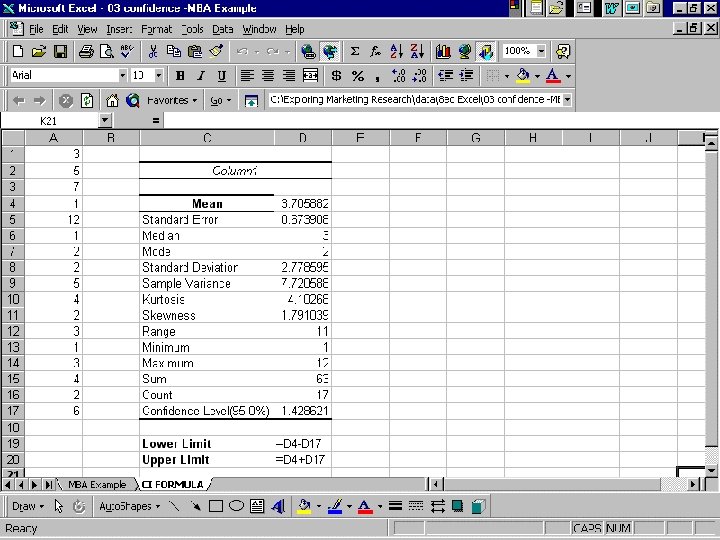

SEVERAL ROWS OF DATA ARE HIDDEN

SEVERAL ROWS OF DATA ARE HIDDEN

Correlation
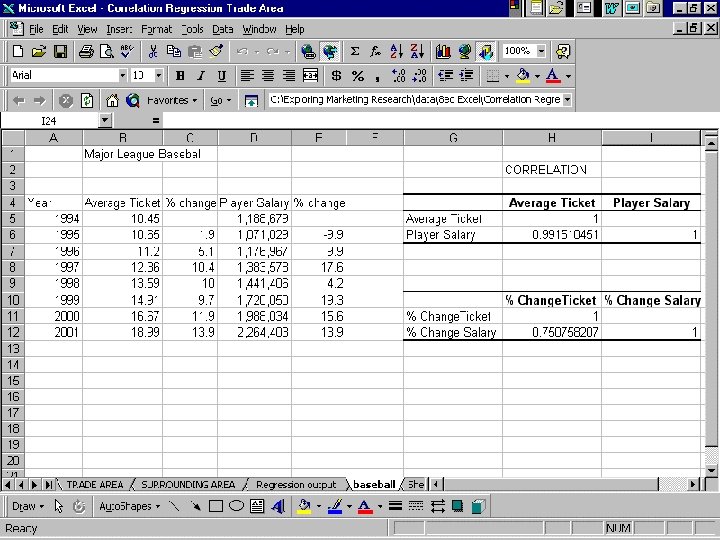
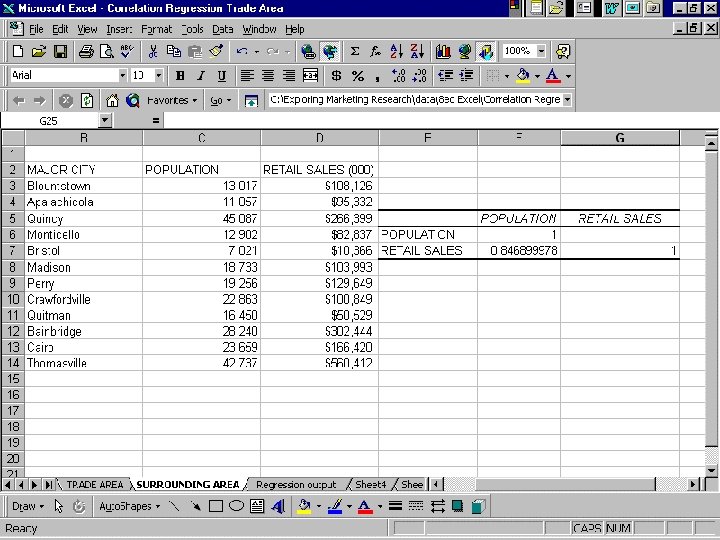

Correlation Coefficient, r =. 75

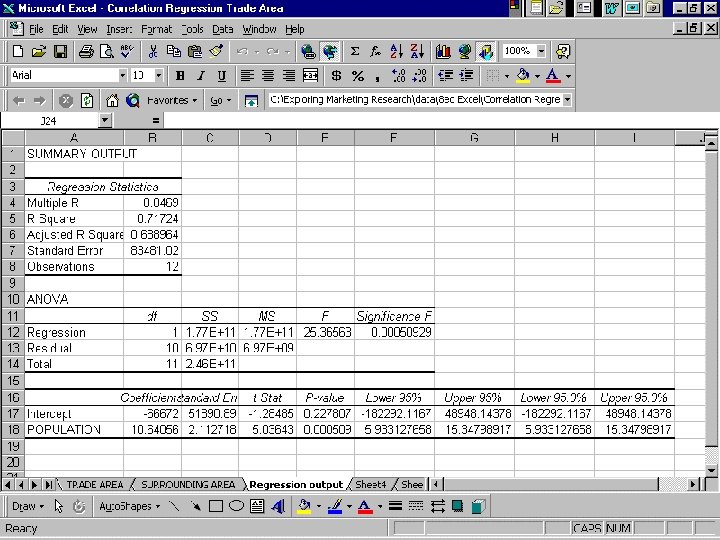
Regression Analysis
- Slides: 62