
Using Metrics to Determine Bear Markets For Meta

Using Metrics to Determine Bear Markets For Meta. Stock Webcast 5/15/2018 Presented by Bryan Johnson Moon Run Report bryan 1522@verizon. net
Disclaimer • This talk on portfolio management and drawdown control is designed to educate investors to identify clues to the market based on stock market data. There is no guarantee that any signal will be timely or accurate. Investors should be aware that the analysis here is designed to inform, not avoid all losses that might be incurred.

World Cup Championship of Stock Trading® • The World Cup Trading Championships have been conducted since 1983. Competitors fund their own accounts and attempt to post the highest possible net return. • Disclaimer: World Cup Championship of Stock Trading® is a registered mark of Robbins Financial Group Ltd. has no affiliation with the products and services offered in this presentation. Use of Robbins Financial Group Ltd. ’s mark is not a sponsorship or endorsement of the products and services offered in this presentation.
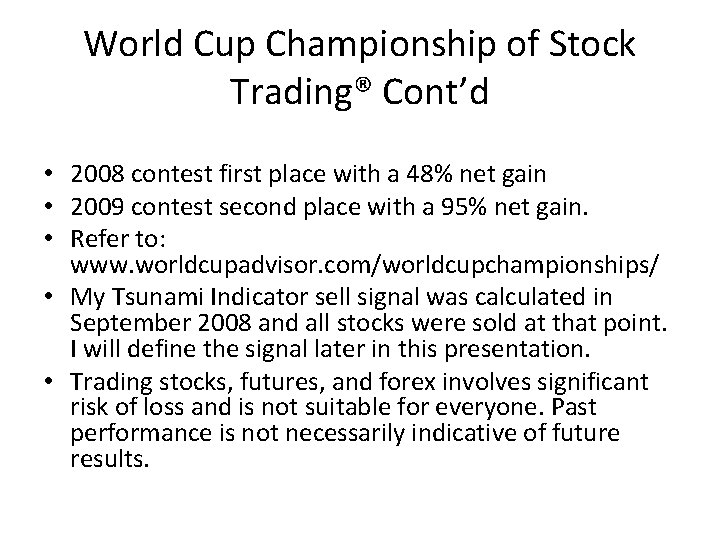
World Cup Championship of Stock Trading® Cont’d • 2008 contest first place with a 48% net gain • 2009 contest second place with a 95% net gain. • Refer to: www. worldcupadvisor. com/worldcupchampionships/ • My Tsunami Indicator sell signal was calculated in September 2008 and all stocks were sold at that point. I will define the signal later in this presentation. • Trading stocks, futures, and forex involves significant risk of loss and is not suitable for everyone. Past performance is not necessarily indicative of future results.
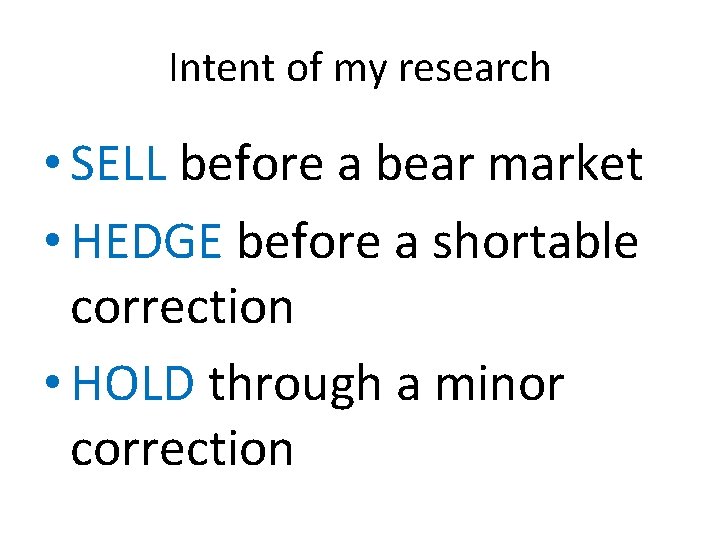
Intent of my research • SELL before a bear market • HEDGE before a shortable correction • HOLD through a minor correction
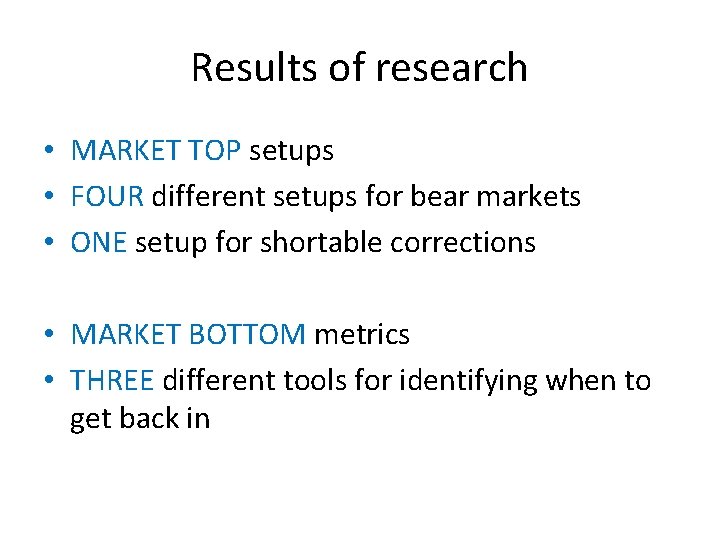
Results of research • MARKET TOP setups • FOUR different setups for bear markets • ONE setup for shortable corrections • MARKET BOTTOM metrics • THREE different tools for identifying when to get back in

Moon Run Report www. moonrunreport. com $10 per month
Moon Run Report part 1 • This is a quantitative-only approach to market timing and stock selection • Timing concepts from this speech are applied • Ten timers on Track Record page • When a candidate sell signal is given, a forecast is made for one of these three: – Bear market – Shortable correction – Minor Correction

Moon Run Report part 2 • Portfolios offer a diversified approach to address conservative to aggressive styles • Portfolios developed with the average investor in mind • Eight portfolios with 5 or 10 stocks in each • Low cost of $10 per month • Emails sent on a timely basis to change stock positions, and a weekend update for status • “Before the bear strikes” book available on Amazon • URL is www. moonrunreport. com


Concepts and Definitions
Overall Concepts 1. The news will confuse 2. I use quantitative analysis for both market timing and stock selection 3. IWM (small cap ETF) is used because it is more sensitive to movements than large cap indexes 4. Market strength is measured to determine if stocks should be sold 5. Metrics are used at the top of the market as well as at the sell signal to determine actions taken
Today’s Presentation • Portfolio 123 for picking stocks • Meta. Stock for market timing • Four ways to determine market tops: – – Tsunami Indicator sell everything signal Fifty New Lows Rule sell everything signal Accelerating New Lows sell everything signal Series of Tops sell everything signal • Long Term S&P Bear Market Timer • Shortable Corrections • Three market bottom reentry signals: – All Clear, Intermediate Buy signal, and Pep Indicator
Definitions • Bear Market – a 20% decline in the S&P 500 from the top to bottom • Exponential moving average (ema)– average of prices with more weight given to most recent days • Normalized New Lows (NNL)– (Nasdaq New Lows) divided by (Nasdaq Advances, Declines and Unchanged 260 day ema) times 3000. • Normalized New Highs(NNH) – substitute Nasdaq New Lows with Nasdaq New Highs to get Normalized New Highs
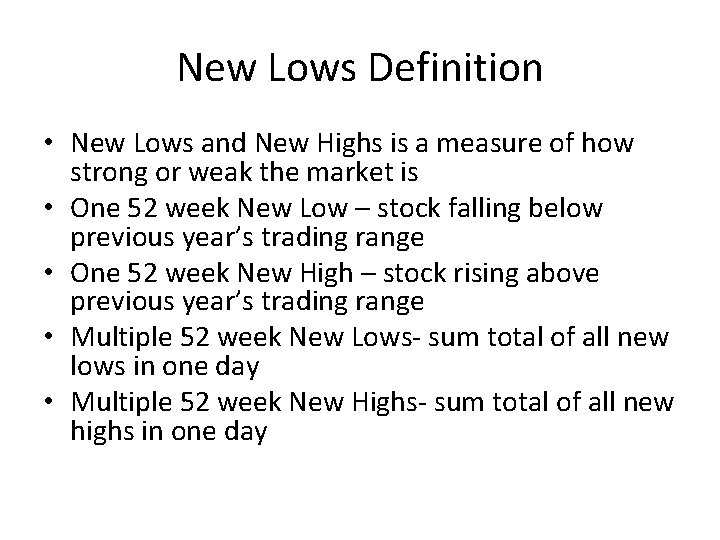
New Lows Definition • New Lows and New Highs is a measure of how strong or weak the market is • One 52 week New Low – stock falling below previous year’s trading range • One 52 week New High – stock rising above previous year’s trading range • Multiple 52 week New Lows- sum total of all new lows in one day • Multiple 52 week New Highs- sum total of all new highs in one day
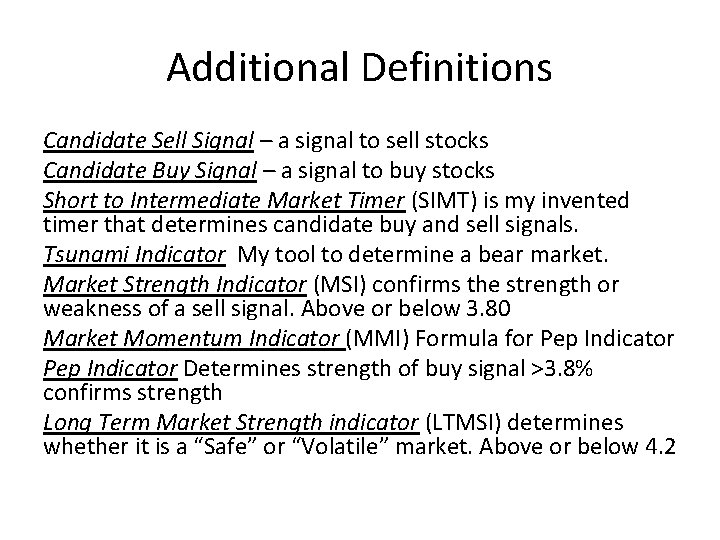
Additional Definitions Candidate Sell Signal – a signal to sell stocks Candidate Buy Signal – a signal to buy stocks Short to Intermediate Market Timer (SIMT) is my invented timer that determines candidate buy and sell signals. Tsunami Indicator My tool to determine a bear market. Market Strength Indicator (MSI) confirms the strength or weakness of a sell signal. Above or below 3. 80 Market Momentum Indicator (MMI) Formula for Pep Indicator Determines strength of buy signal >3. 8% confirms strength Long Term Market Strength indicator (LTMSI) determines whether it is a “Safe” or “Volatile” market. Above or below 4. 2
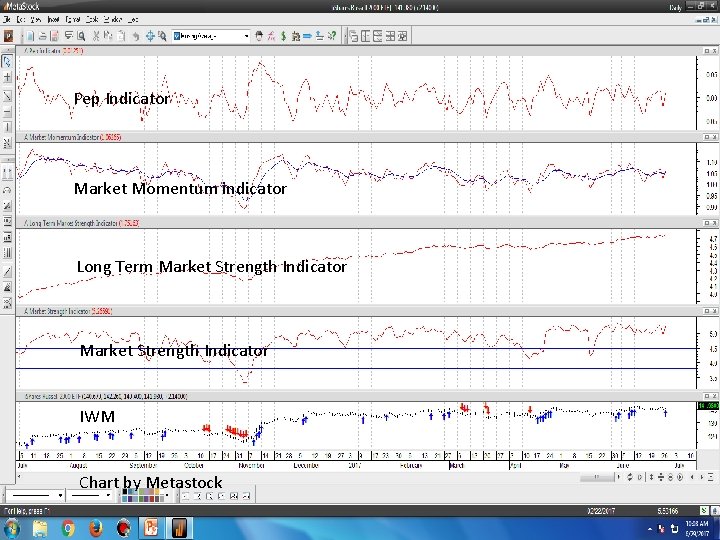
Pep Indicator Market Momentum indicator Long Term Market Strength Indicator IWM Chart by Metastock

The Aim of Investing

Objectives of Investing • • • Buy quality and wait Weed the garden Defense wins championships Coordinate market timing with stock selection Combining both – Market timing with Metastock – Stock selection ideas with Portfolio 123 Needs to be consistent through the years by backtesting
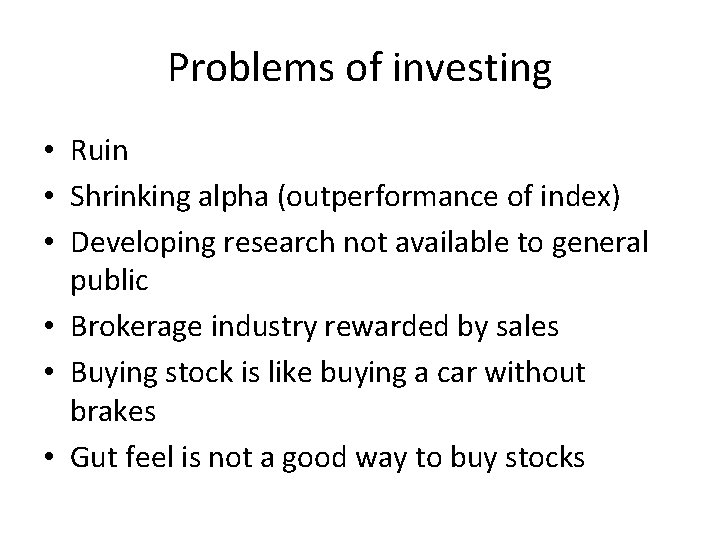
Problems of investing • Ruin • Shrinking alpha (outperformance of index) • Developing research not available to general public • Brokerage industry rewarded by sales • Buying stock is like buying a car without brakes • Gut feel is not a good way to buy stocks

Solution to Investing • Determine when a bear market or shortable correction is taking place • Raise cash, go short, or hedge when the market is deemed dangerous • Invest in smaller number of stocks in a backtested portfolio rather than megabucks mutual funds when market deemed investable

Examples of what I use
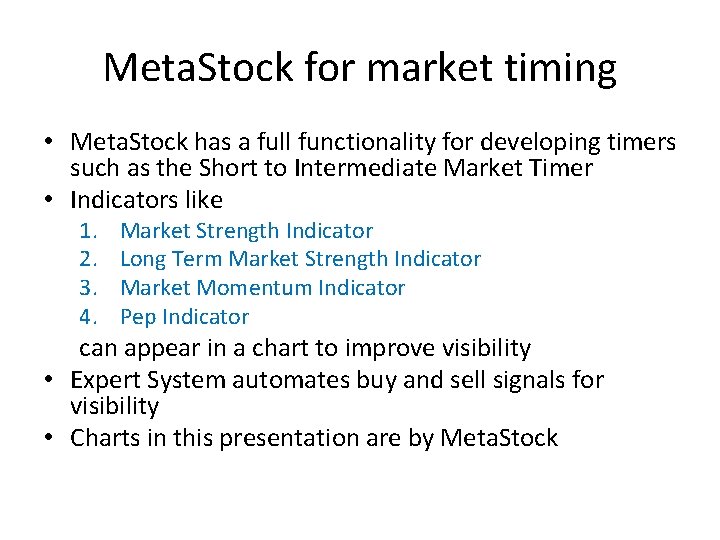
Meta. Stock for market timing • Meta. Stock has a full functionality for developing timers such as the Short to Intermediate Market Timer • Indicators like 1. 2. 3. 4. Market Strength Indicator Long Term Market Strength Indicator Market Momentum Indicator Pep Indicator can appear in a chart to improve visibility • Expert System automates buy and sell signals for visibility • Charts in this presentation are by Meta. Stock
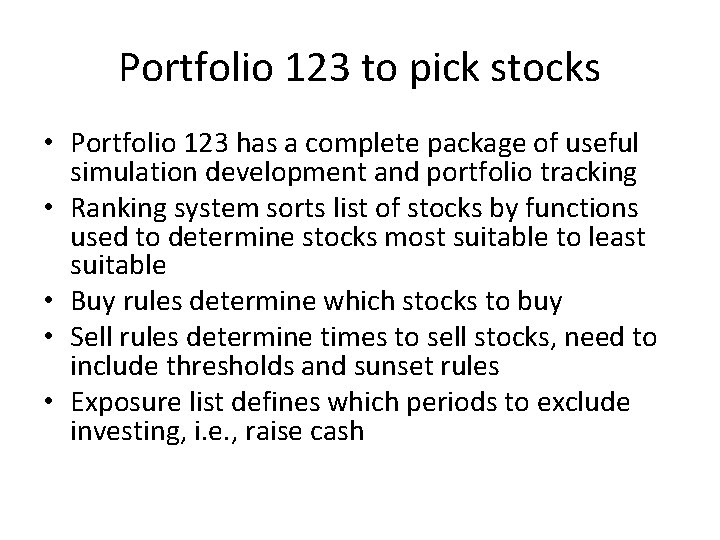
Portfolio 123 to pick stocks • Portfolio 123 has a complete package of useful simulation development and portfolio tracking • Ranking system sorts list of stocks by functions used to determine stocks most suitable to least suitable • Buy rules determine which stocks to buy • Sell rules determine times to sell stocks, need to include thresholds and sunset rules • Exposure list defines which periods to exclude investing, i. e. , raise cash
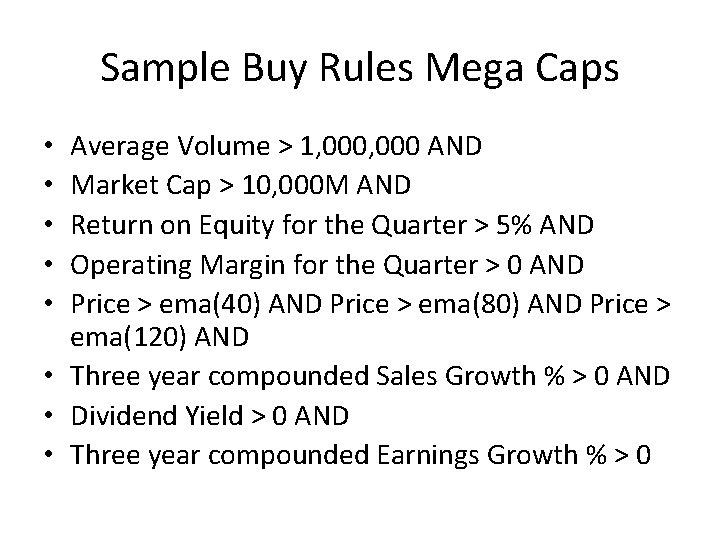
Sample Buy Rules Mega Caps Average Volume > 1, 000 AND Market Cap > 10, 000 M AND Return on Equity for the Quarter > 5% AND Operating Margin for the Quarter > 0 AND Price > ema(40) AND Price > ema(80) AND Price > ema(120) AND • Three year compounded Sales Growth % > 0 AND • Dividend Yield > 0 AND • Three year compounded Earnings Growth % > 0 • • •
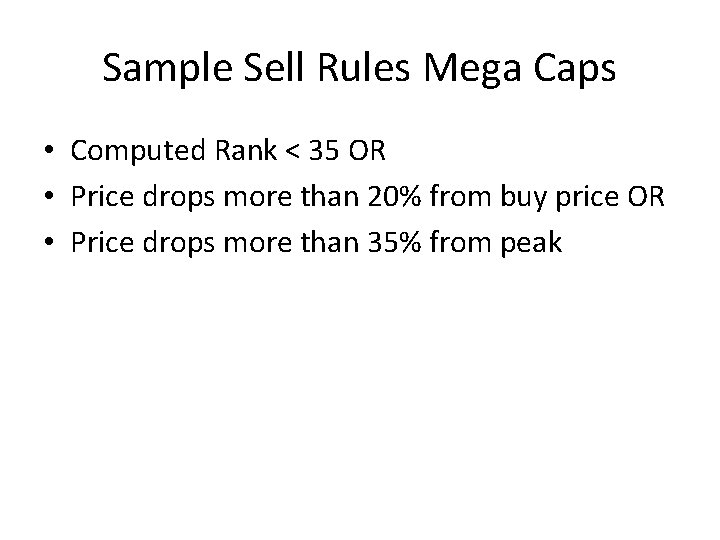
Sample Sell Rules Mega Caps • Computed Rank < 35 OR • Price drops more than 20% from buy price OR • Price drops more than 35% from peak
Ranking System for Mega Caps • Ranking System is Momentum Value (P 123) which uses price movement comparisons as well as value stock fundamentals • Ranking system determines most suitable to least suitable for selection from top to bottom • Ranking systems are targeted for different styles of stock selection
Timing Metrics
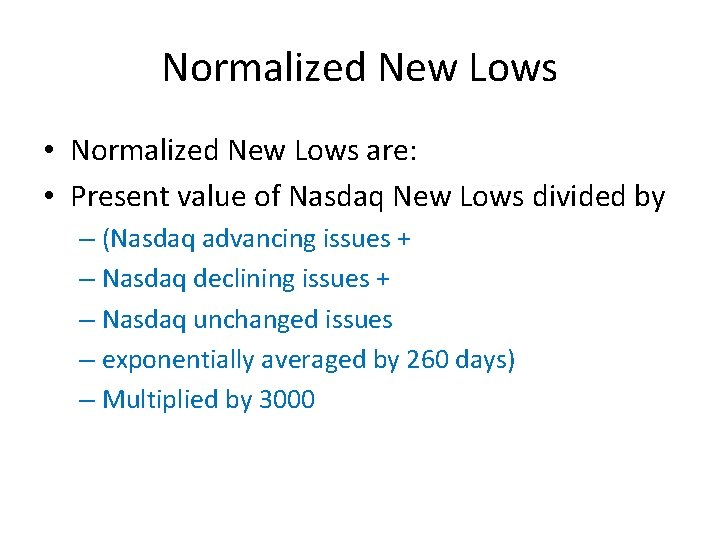
Normalized New Lows • Normalized New Lows are: • Present value of Nasdaq New Lows divided by – (Nasdaq advancing issues + – Nasdaq declining issues + – Nasdaq unchanged issues – exponentially averaged by 260 days) – Multiplied by 3000
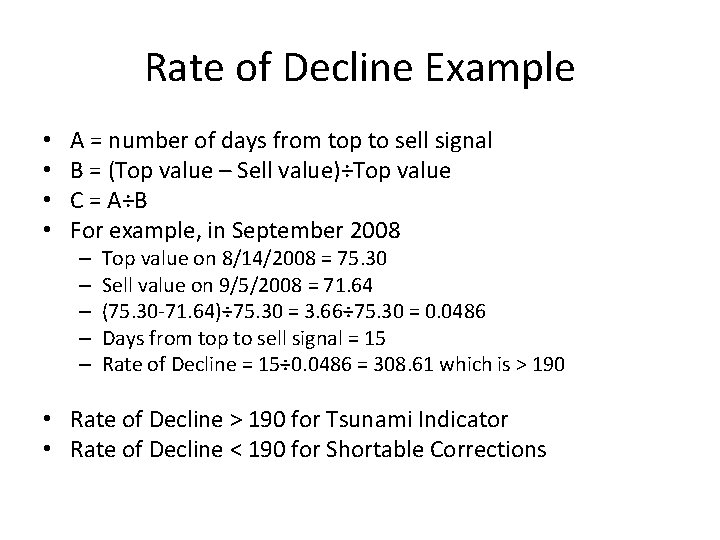
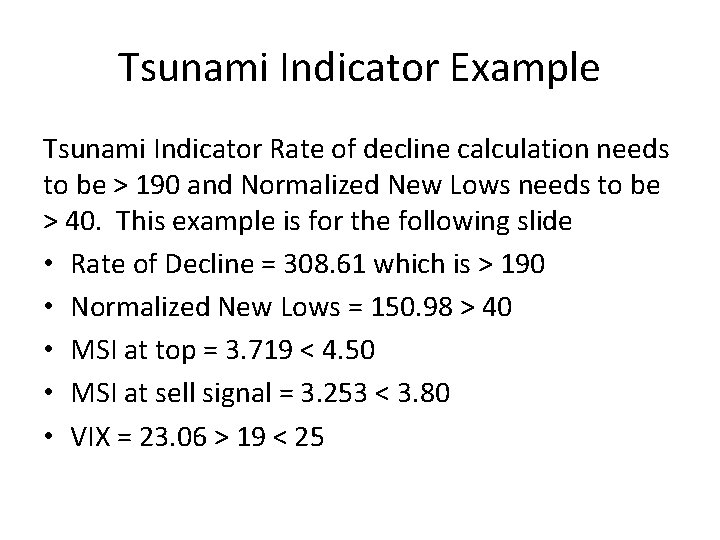
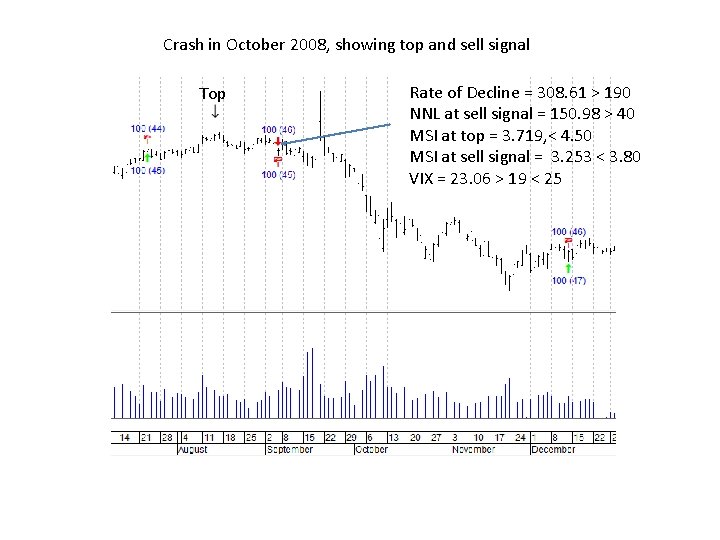
Rate of Decline Example • • A = number of days from top to sell signal B = (Top value – Sell value)÷Top value C = A÷B For example, in September 2008 – – – Top value on 8/14/2008 = 75. 30 Sell value on 9/5/2008 = 71. 64 (75. 30 -71. 64)÷ 75. 30 = 3. 66÷ 75. 30 = 0. 0486 Days from top to sell signal = 15 Rate of Decline = 15÷ 0. 0486 = 308. 61 which is > 190 • Rate of Decline > 190 for Tsunami Indicator • Rate of Decline < 190 for Shortable Corrections
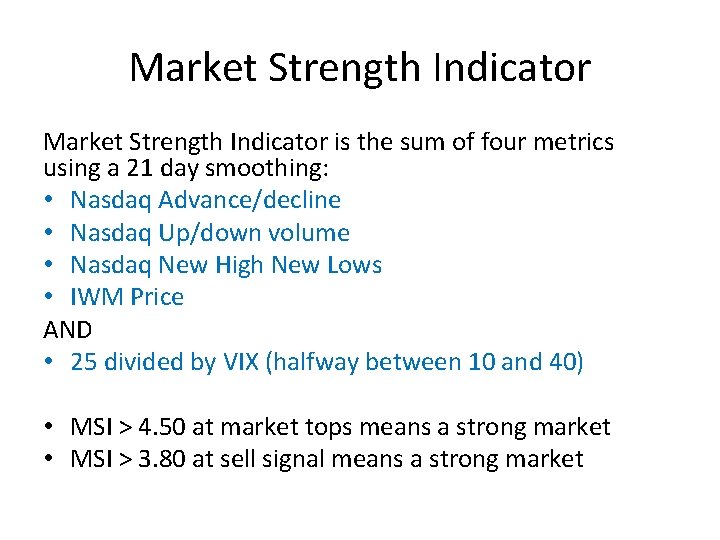
Market Strength Indicator is the sum of four metrics using a 21 day smoothing: • Nasdaq Advance/decline • Nasdaq Up/down volume • Nasdaq New High New Lows • IWM Price AND • 25 divided by VIX (halfway between 10 and 40) • MSI > 4. 50 at market tops means a strong market • MSI > 3. 80 at sell signal means a strong market
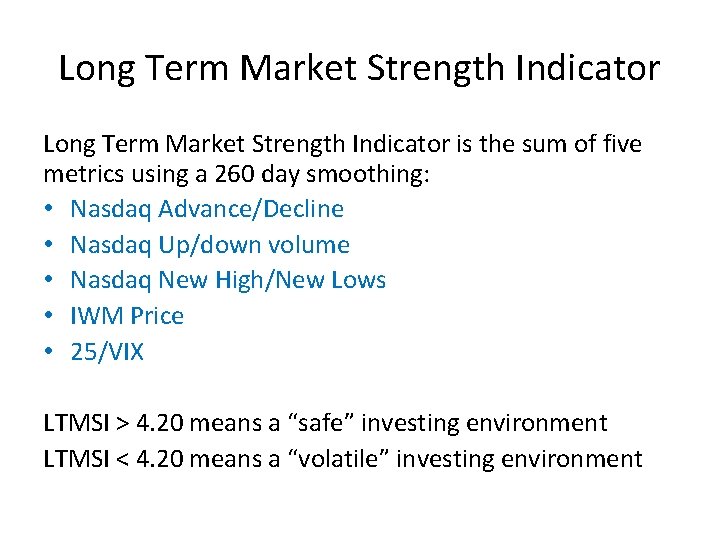
Long Term Market Strength Indicator is the sum of five metrics using a 260 day smoothing: • Nasdaq Advance/Decline • Nasdaq Up/down volume • Nasdaq New High/New Lows • IWM Price • 25/VIX LTMSI > 4. 20 means a “safe” investing environment LTMSI < 4. 20 means a “volatile” investing environment

Bull Market top formations
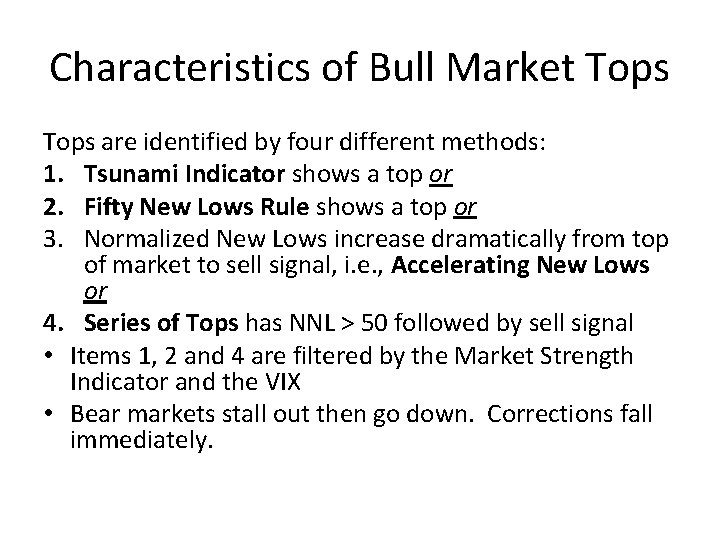
Characteristics of Bull Market Tops are identified by four different methods: 1. Tsunami Indicator shows a top or 2. Fifty New Lows Rule shows a top or 3. Normalized New Lows increase dramatically from top of market to sell signal, i. e. , Accelerating New Lows or 4. Series of Tops has NNL > 50 followed by sell signal • Items 1, 2 and 4 are filtered by the Market Strength Indicator and the VIX • Bear markets stall out then go down. Corrections fall immediately.
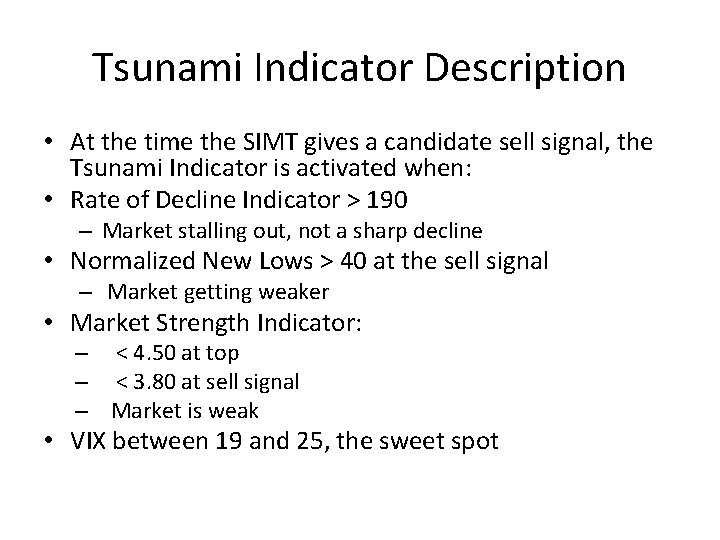
Tsunami Indicator Description • At the time the SIMT gives a candidate sell signal, the Tsunami Indicator is activated when: • Rate of Decline Indicator > 190 – Market stalling out, not a sharp decline • Normalized New Lows > 40 at the sell signal – Market getting weaker • Market Strength Indicator: – < 4. 50 at top – < 3. 80 at sell signal – Market is weak • VIX between 19 and 25, the sweet spot
Tsunami Indicator Example Tsunami Indicator Rate of decline calculation needs to be > 190 and Normalized New Lows needs to be > 40. This example is for the following slide • Rate of Decline = 308. 61 which is > 190 • Normalized New Lows = 150. 98 > 40 • MSI at top = 3. 719 < 4. 50 • MSI at sell signal = 3. 253 < 3. 80 • VIX = 23. 06 > 19 < 25
Crash in October 2008, showing top and sell signal Top Rate of Decline = 308. 61 > 190 NNL at sell signal = 150. 98 > 40 MSI at top = 3. 719, < 4. 50 MSI at sell signal = 3. 253 < 3. 80 VIX = 23. 06 > 19 < 25
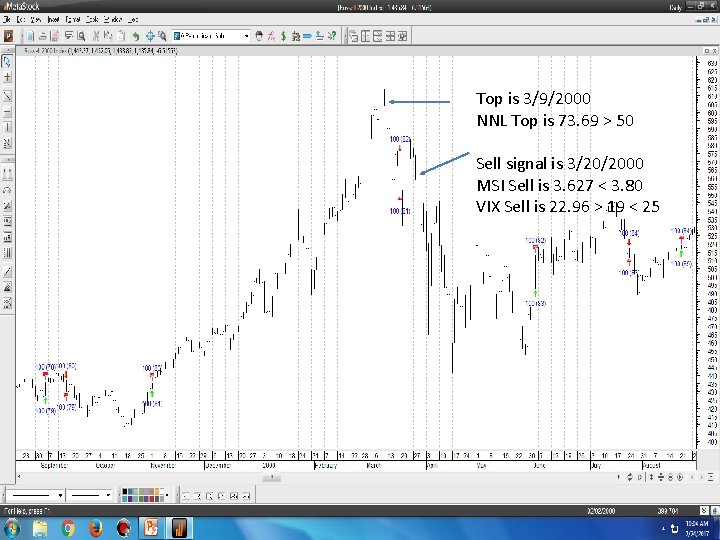
Fifty New Lows Rule • The Fifty New Lows Rule shows that the market is splitting apart and unsustainable • Normalized New Lows > 50 at the top • Rate of Decline is not used • Like Tsunami indicator: – Market Strength Indicator < 4. 50 at top – Market Strength Indicator < 3. 80 at sell signal • VIX > 19 AND < 25 at sell signal, the sweet spot
Top is 3/9/2000 NNL Top is 73. 69 > 50 Sell signal is 3/20/2000 MSI Sell is 3. 627 < 3. 80 VIX Sell is 22. 96 > 19 < 25
Accelerating New Lows determines when the market is falling at precipitous speed Calculation: NNL at sell signal minus NNL at top divided by NNL at sell signal plus NNL at top • If calculation is 80% or more then this market is plummeting too fast to be invested Re-enter market when Pep Indicator > 3. 8% at buy signal
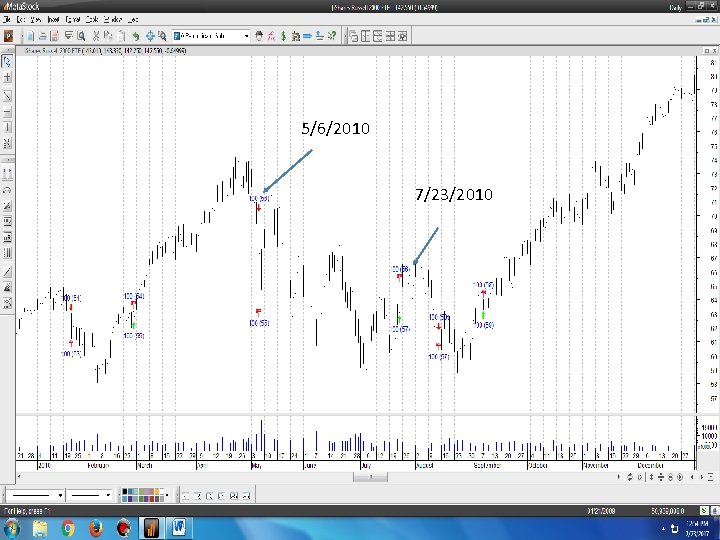
5/6/2010 7/23/2010 Pep 6. 19% < 3. 8%
Series of Tops • This is a chart formation that develops over a period of time. • Years 2007 and 2011 have this feature • The New Lows at the tops > 50 but the MSI or VIX may not confirm a sell signal • The sell signal to follow confirmed when: – MSI < 4. 50 at top – MSI < 3. 80 at the sell signal – VIX > 19 and < 23 at the sell signal
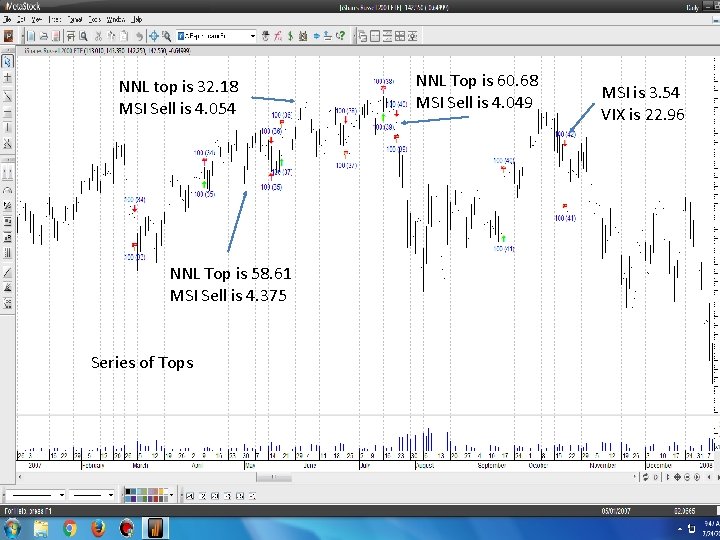
March 9, 2000 NNL top is 32. 18 MSI Sell is 4. 054 NNL at top = 73. 69 > 50 NNL Top is 60. 68 MSI at top = 4. 019 < 4. 50 MSI Sell is 4. 049 MSI at sell signal = 3. 627 < 3. 80 VIX at sell signal = 22. 96 > 19 < 25 MSI is 3. 54 VIX is 22. 96 Pep Indicator = 12. 13% > 3. 8% Intermediate Buy = 16. 290 > 8 All Clear = 0. 493 < 2 NNL Top is 58. 61 MSI Sell is 4. 375 2000 Series of Tops Chart by Metstock June 5, 2000
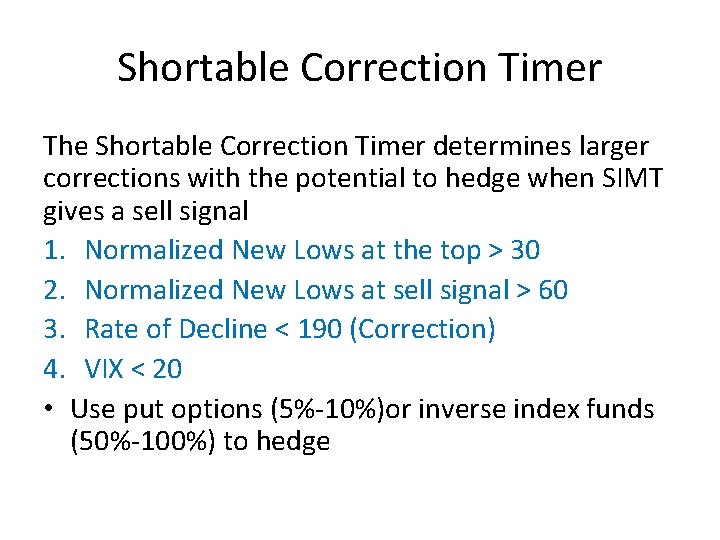
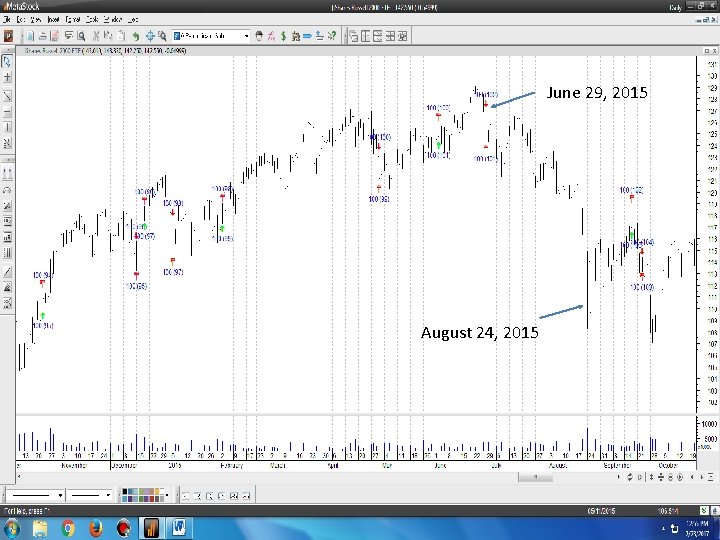
Shortable Correction Timer The Shortable Correction Timer determines larger corrections with the potential to hedge when SIMT gives a sell signal 1. Normalized New Lows at the top > 30 2. Normalized New Lows at sell signal > 60 3. Rate of Decline < 190 (Correction) 4. VIX < 20 • Use put options (5%-10%)or inverse index funds (50%-100%) to hedge
June 29, 2015 August 24, 2015
Bear Market Bottom Signals
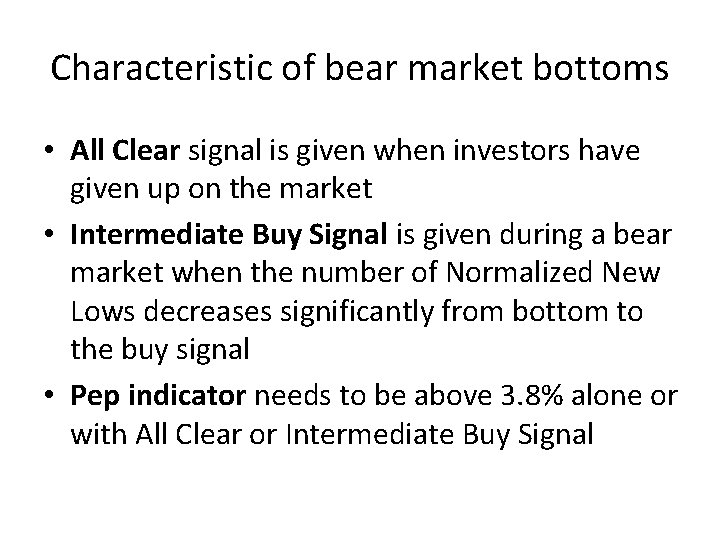
Characteristic of bear market bottoms • All Clear signal is given when investors have given up on the market • Intermediate Buy Signal is given during a bear market when the number of Normalized New Lows decreases significantly from bottom to the buy signal • Pep indicator needs to be above 3. 8% alone or with All Clear or Intermediate Buy Signal
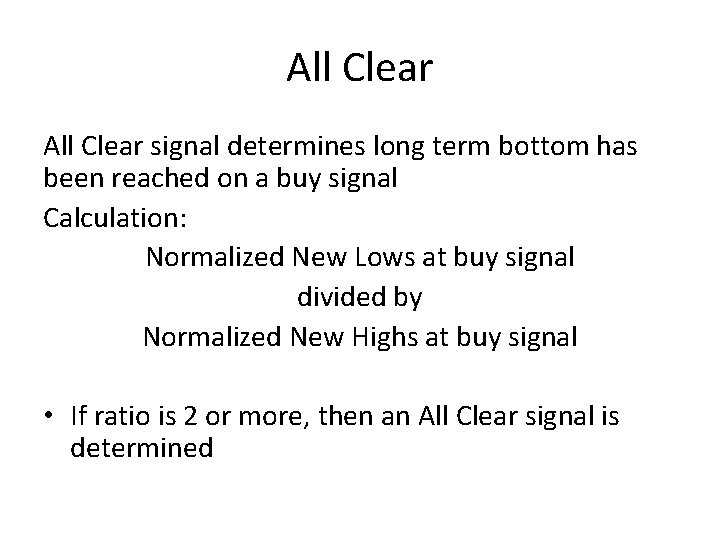
All Clear signal determines long term bottom has been reached on a buy signal Calculation: Normalized New Lows at buy signal divided by Normalized New Highs at buy signal • If ratio is 2 or more, then an All Clear signal is determined
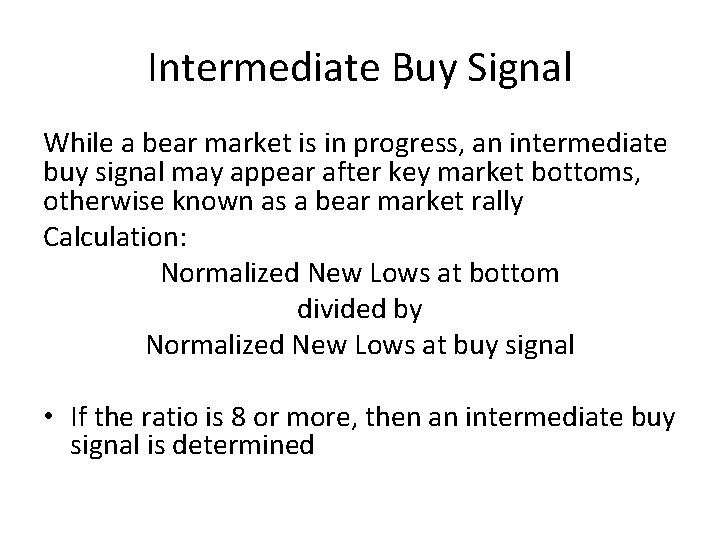
Intermediate Buy Signal While a bear market is in progress, an intermediate buy signal may appear after key market bottoms, otherwise known as a bear market rally Calculation: Normalized New Lows at bottom divided by Normalized New Lows at buy signal • If the ratio is 8 or more, then an intermediate buy signal is determined
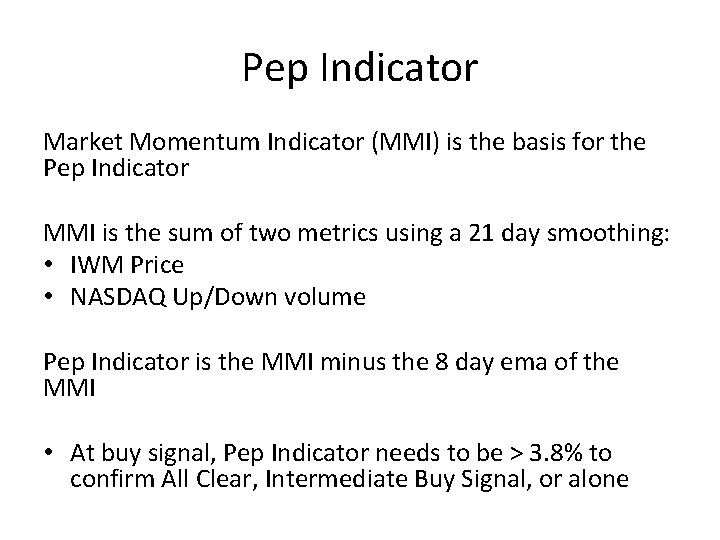
Pep Indicator Market Momentum Indicator (MMI) is the basis for the Pep Indicator MMI is the sum of two metrics using a 21 day smoothing: • IWM Price • NASDAQ Up/Down volume Pep Indicator is the MMI minus the 8 day ema of the MMI • At buy signal, Pep Indicator needs to be > 3. 8% to confirm All Clear, Intermediate Buy Signal, or alone
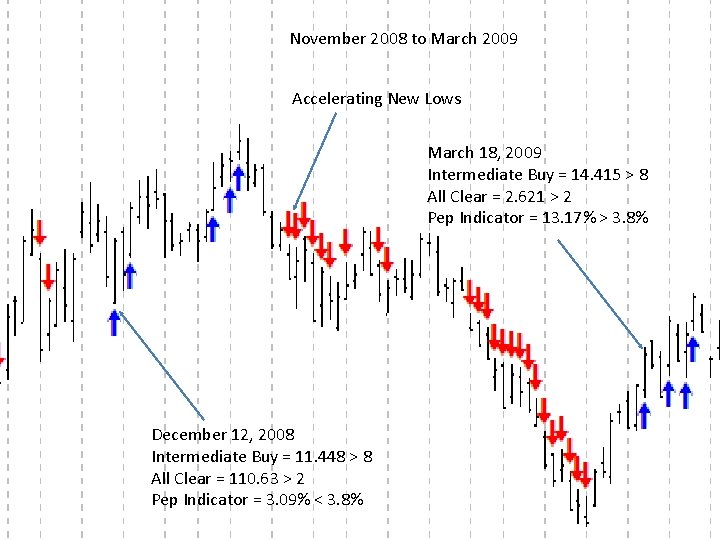
November 2008 to March 2009 Accelerating New Lows March 18, 2009 Intermediate Buy = 14. 415 > 8 All Clear = 2. 621 > 2 Pep Indicator = 13. 17% > 3. 8% December 12, 2008 Intermediate Buy = 11. 448 > 8 All Clear = 110. 63 > 2 Pep Indicator = 3. 09% < 3. 8%
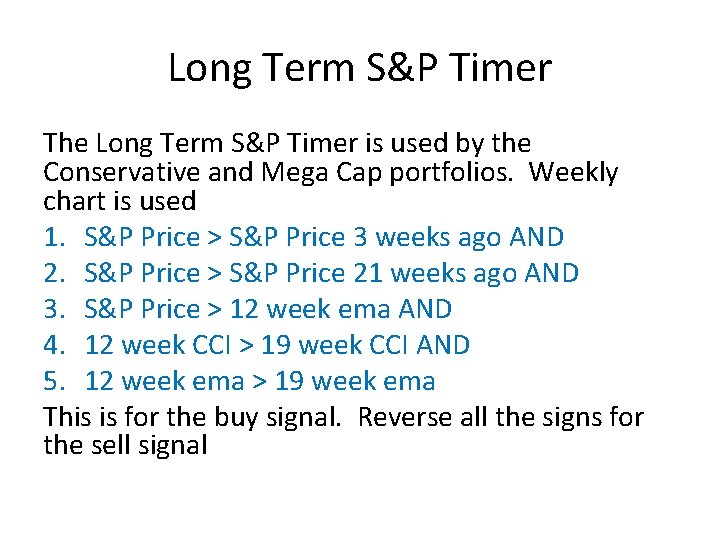
Long Term S&P Timer The Long Term S&P Timer is used by the Conservative and Mega Cap portfolios. Weekly chart is used 1. S&P Price > S&P Price 3 weeks ago AND 2. S&P Price > S&P Price 21 weeks ago AND 3. S&P Price > 12 week ema AND 4. 12 week CCI > 19 week CCI AND 5. 12 week ema > 19 week ema This is for the buy signal. Reverse all the signs for the sell signal
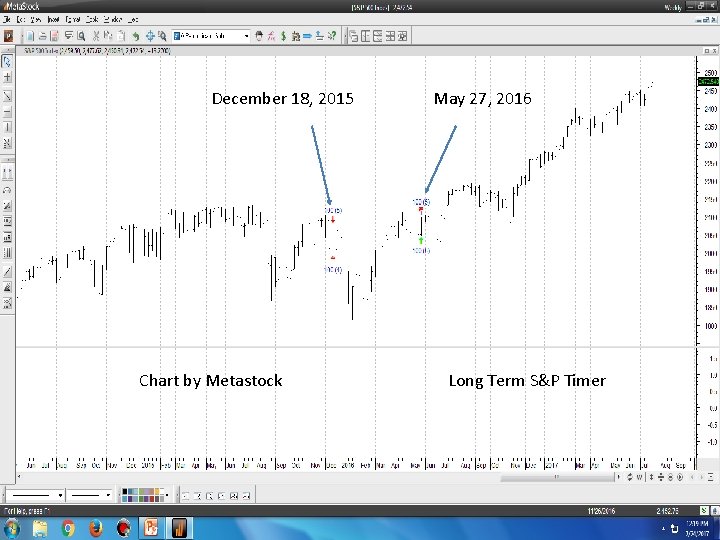
December 18, 2015 Chart by Metastock May 27, 2016 Long Term S&P Timer
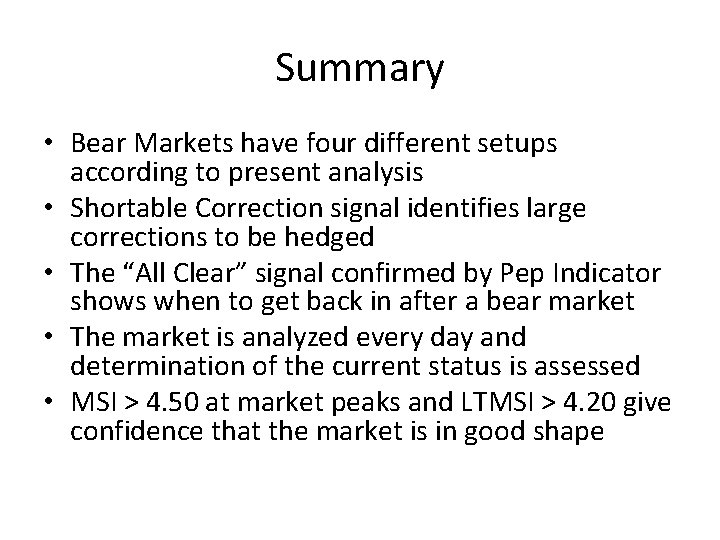
Summary • Bear Markets have four different setups according to present analysis • Shortable Correction signal identifies large corrections to be hedged • The “All Clear” signal confirmed by Pep Indicator shows when to get back in after a bear market • The market is analyzed every day and determination of the current status is assessed • MSI > 4. 50 at market peaks and LTMSI > 4. 20 give confidence that the market is in good shape

Bear Markets Examples
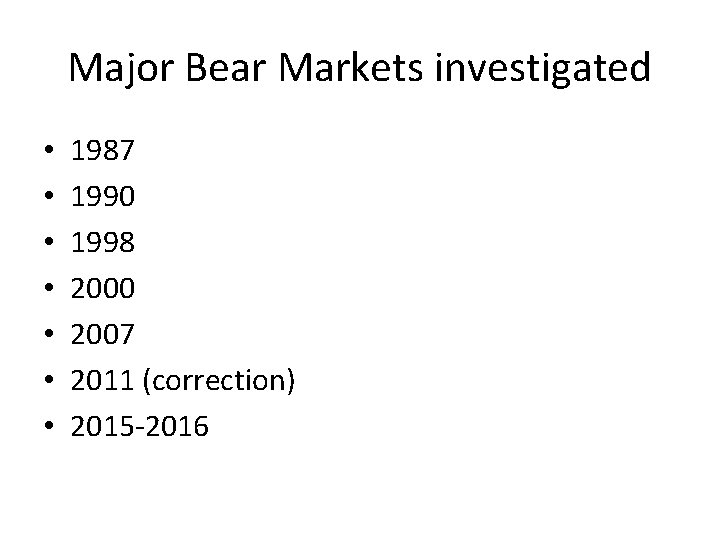
Major Bear Markets investigated • • 1987 1990 1998 2000 2007 2011 (correction) 2015 -2016
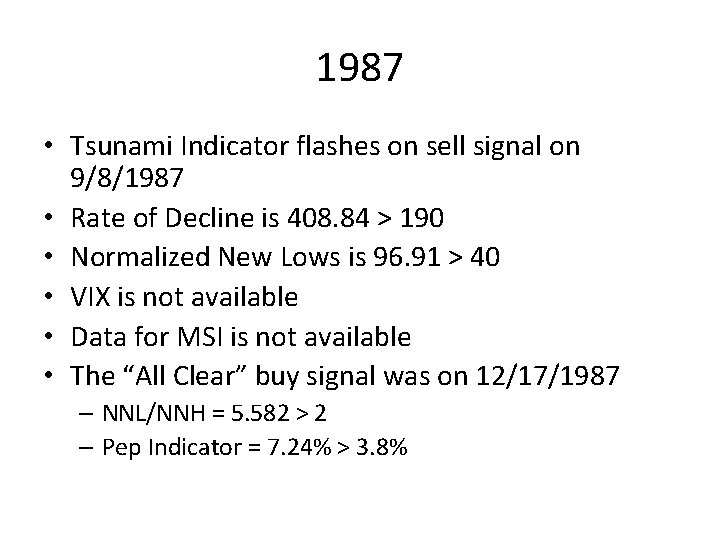
1987 • Tsunami Indicator flashes on sell signal on 9/8/1987 • Rate of Decline is 408. 84 > 190 • Normalized New Lows is 96. 91 > 40 • VIX is not available • Data for MSI is not available • The “All Clear” buy signal was on 12/17/1987 – NNL/NNH = 5. 582 > 2 – Pep Indicator = 7. 24% > 3. 8%
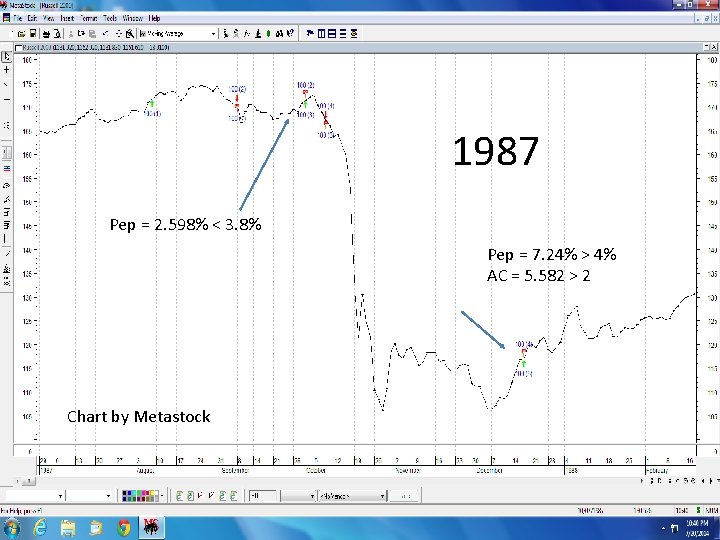
1987 Pep = 2. 598% < 3. 8% Pep = 7. 24% > 4% AC = 5. 582 > 2 Chart by Metastock
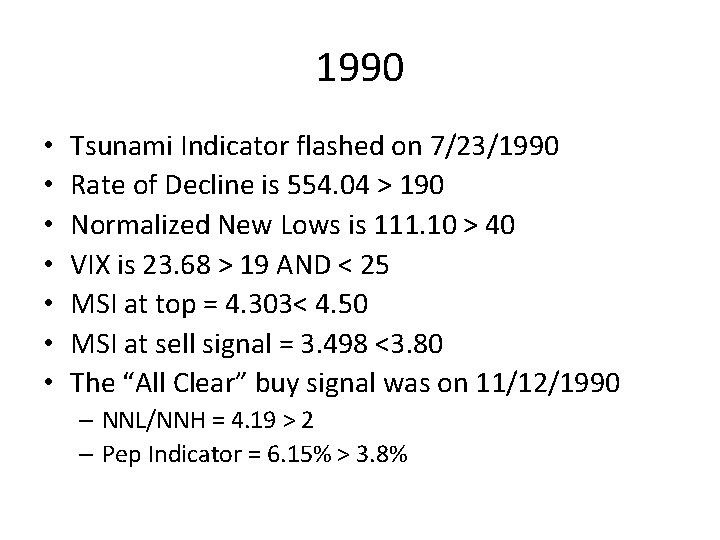
1990 • • Tsunami Indicator flashed on 7/23/1990 Rate of Decline is 554. 04 > 190 Normalized New Lows is 111. 10 > 40 VIX is 23. 68 > 19 AND < 25 MSI at top = 4. 303< 4. 50 MSI at sell signal = 3. 498 <3. 80 The “All Clear” buy signal was on 11/12/1990 – NNL/NNH = 4. 19 > 2 – Pep Indicator = 6. 15% > 3. 8%
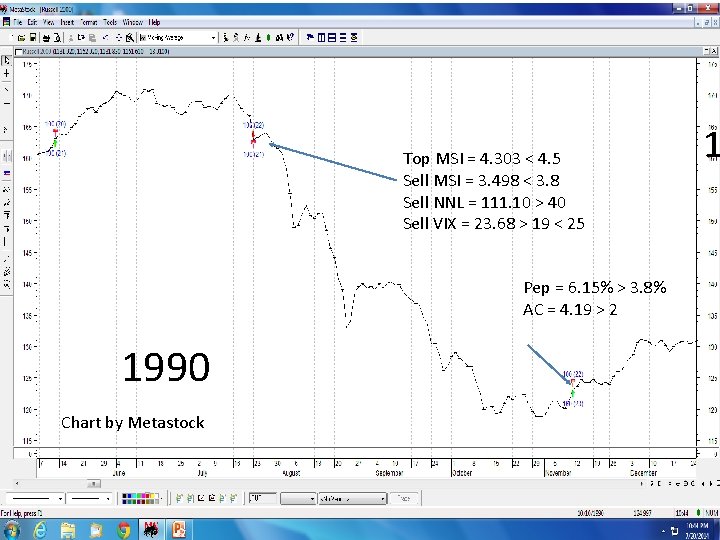
Top MSI = 4. 303 < 4. 5 Sell MSI = 3. 498 < 3. 8 Sell NNL = 111. 10 > 40 Sell VIX = 23. 68 > 19 < 25 Pep = 6. 15% > 3. 8% AC = 4. 19 > 2 1990 Chart by Metastock 1
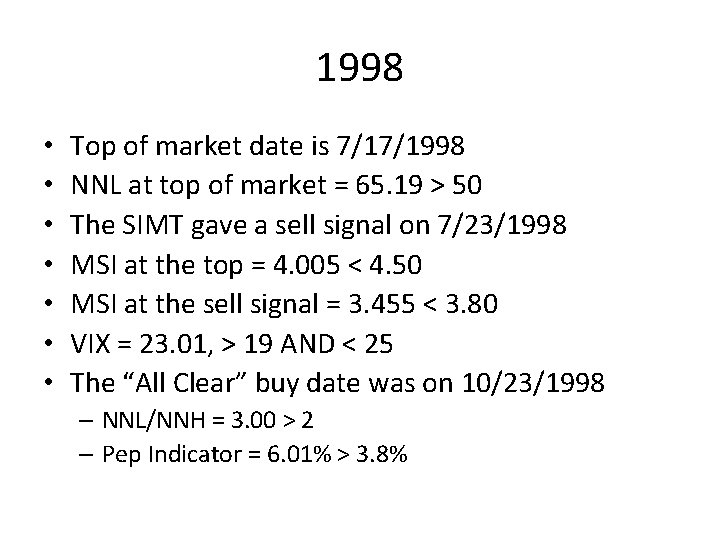
1998 • • Top of market date is 7/17/1998 NNL at top of market = 65. 19 > 50 The SIMT gave a sell signal on 7/23/1998 MSI at the top = 4. 005 < 4. 50 MSI at the sell signal = 3. 455 < 3. 80 VIX = 23. 01, > 19 AND < 25 The “All Clear” buy date was on 10/23/1998 – NNL/NNH = 3. 00 > 2 – Pep Indicator = 6. 01% > 3. 8%
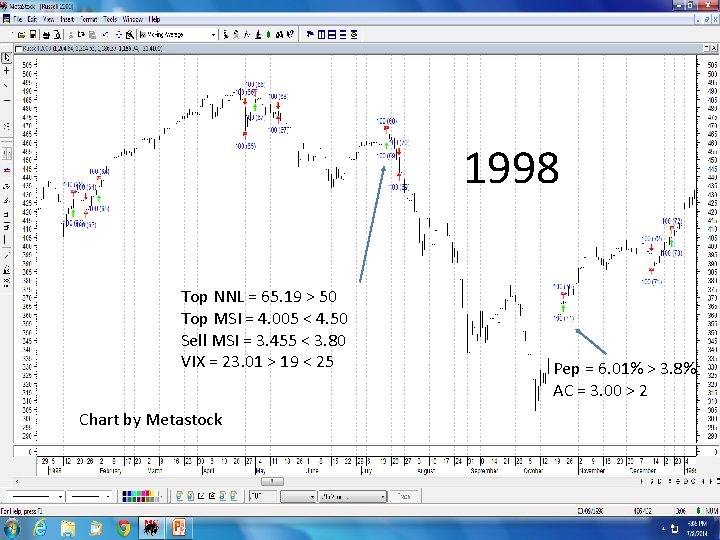
1998 Top NNL = 65. 19 > 50 Top MSI = 4. 005 < 4. 50 Sell MSI = 3. 455 < 3. 80 VIX = 23. 01 > 19 < 25 Chart by Metastock Pep = 6. 01% > 3. 8% AC = 3. 00 > 2
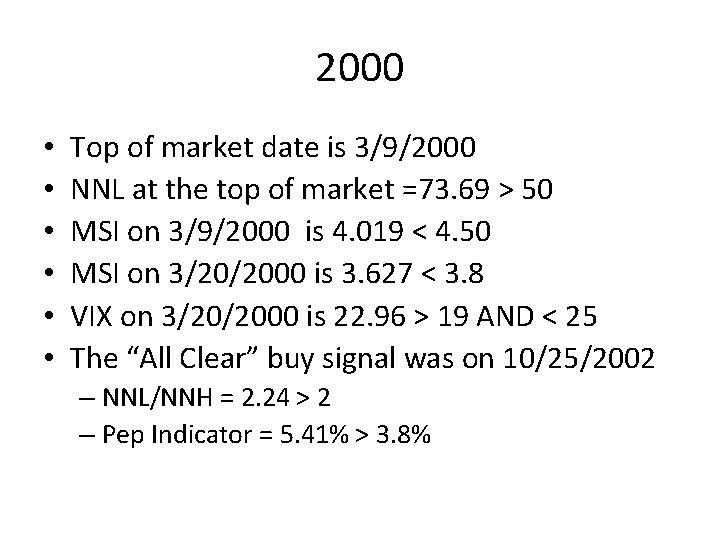
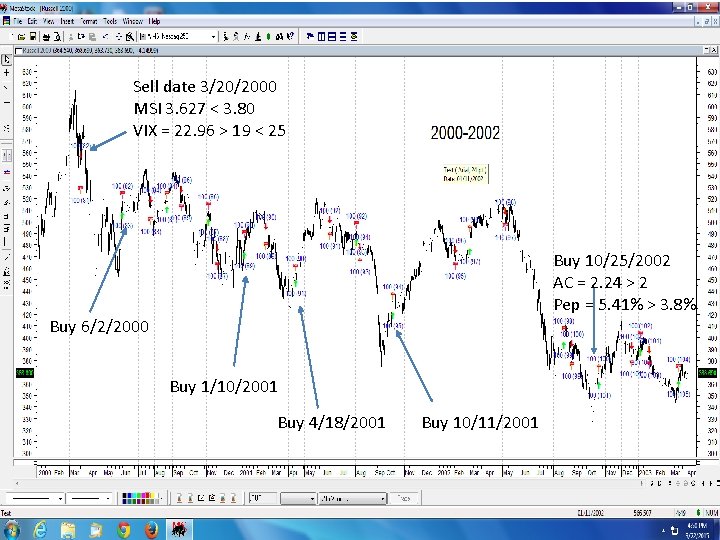
2000 • • • Top of market date is 3/9/2000 NNL at the top of market =73. 69 > 50 MSI on 3/9/2000 is 4. 019 < 4. 50 MSI on 3/20/2000 is 3. 627 < 3. 8 VIX on 3/20/2000 is 22. 96 > 19 AND < 25 The “All Clear” buy signal was on 10/25/2002 – NNL/NNH = 2. 24 > 2 – Pep Indicator = 5. 41% > 3. 8%
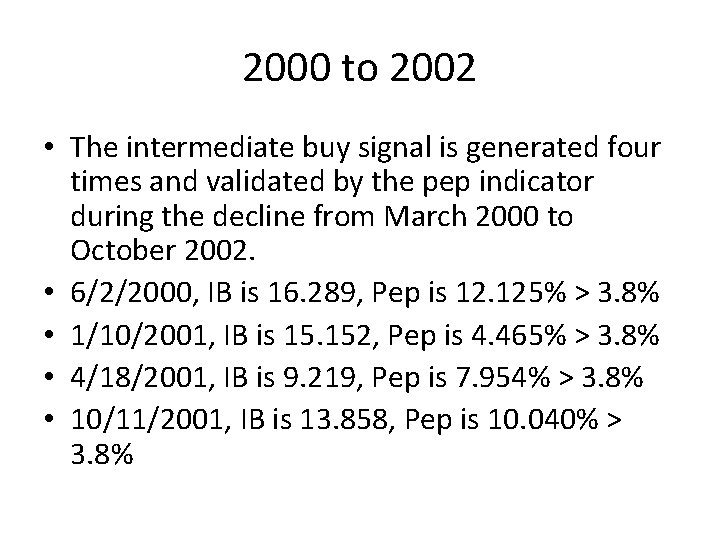
2000 to 2002 • The intermediate buy signal is generated four times and validated by the pep indicator during the decline from March 2000 to October 2002. • 6/2/2000, IB is 16. 289, Pep is 12. 125% > 3. 8% • 1/10/2001, IB is 15. 152, Pep is 4. 465% > 3. 8% • 4/18/2001, IB is 9. 219, Pep is 7. 954% > 3. 8% • 10/11/2001, IB is 13. 858, Pep is 10. 040% > 3. 8%
Sell date 3/20/2000 MSI 3. 627 < 3. 80 VIX = 22. 96 > 19 < 25 Buy 10/25/2002 AC = 2. 24 > 2 Pep = 5. 41% > 3. 8% Buy 6/2/2000 Buy 1/10/2001 Buy 4/18/2001 Buy 10/11/2001
2007 • • • Tsunami flashes on three sell signal dates: 5/15/2007 NNL is 114. 47. MSI is 4. 374, VIX is 14. 01 6/25/2007 NNL is 84. 30, MSI is 4. 054, VIX is 16. 65 7/23/2007 NNL is 127. 10, MSI IS 4. 049, VIX is 16. 81 All MSI’s > 3. 80, All VIX’s < 19 So Tsunami denied by both MSI and VIX • • • 10/19/2007 is next sell signal NNL is 176. 84 > 40, MSI is 3. 574 < 3. 80, VIX is 22. 96, > 19 < 25 Bottom date is 12/12/2008 “All Clear” NNL/NNH = 111. 63 > 2 Pep Indicator = 3. 09% < 3. 8% All Clear overridden by Pep Indicator < 3. 8% so it denies entry
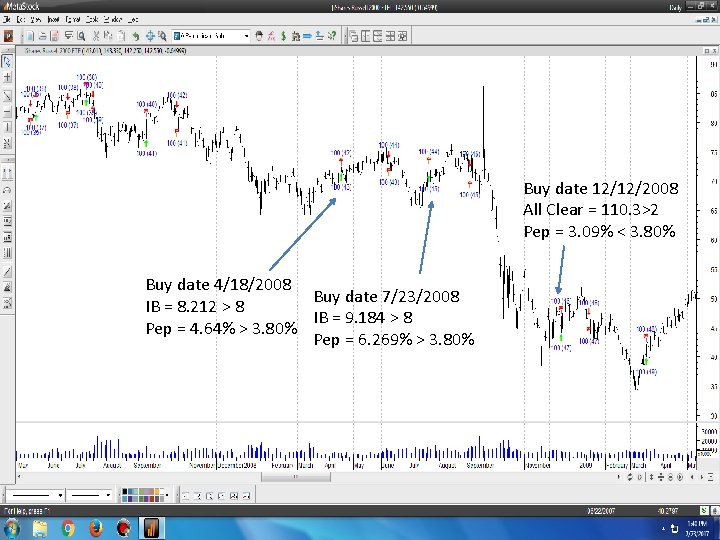
2007 to 2009 • The intermediate buy signal is generated twice between October 2007 to December 2008 • 4/18/2008 IB is 8. 212 >8, Pep is 4. 640% > 3. 8% • 7/23/2008 IB is 9. 184 > 8, Pep is 6. 269% > 3. 8% • Buy signal on 12/12/2008 • All Clear = 110. 306 > 2 • Pep Indicator = 3. 094% < 3. 8% denies entry • An Accelerating New Lows calculation determined on the sell signal 1/14/2009 was 85. 53% > 80%, • The next buy signal was on 3/18/2009 – All Clear is 2. 621 > 2 – Pep Indicator = 13. 17% > 3. 8%
Tsunami Intermediate Buy Signals Buy date 4/18/2008 Buy date 7/23/2008 IB = 8. 212 > 8 IB = 9. 184 > 8 Pep = 4. 64% > 3. 80% Pep = 6. 269% > 3. 80% Buy date 12/12/2008 All Clear = 110. 3>2 Pep = 3. 09% < 3. 80% All Clear
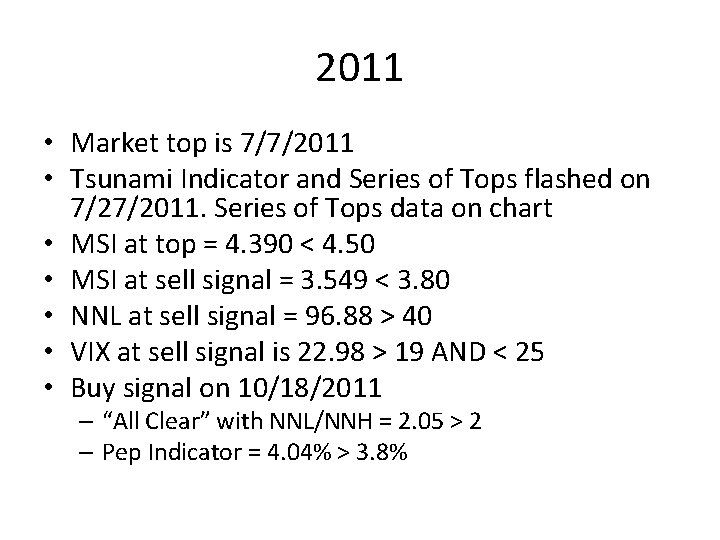
2011 • Market top is 7/7/2011 • Tsunami Indicator and Series of Tops flashed on 7/27/2011. Series of Tops data on chart • MSI at top = 4. 390 < 4. 50 • MSI at sell signal = 3. 549 < 3. 80 • NNL at sell signal = 96. 88 > 40 • VIX at sell signal is 22. 98 > 19 AND < 25 • Buy signal on 10/18/2011 – “All Clear” with NNL/NNH = 2. 05 > 2 – Pep Indicator = 4. 04% > 3. 8%
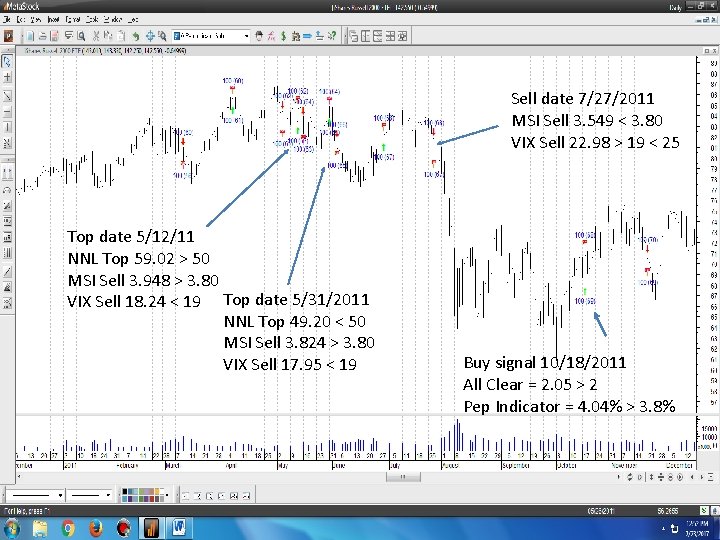
Sell date 7/27/2011 MSI Sell 3. 549 < 3. 80 VIX Sell 22. 98 > 19 < 25 Top date 5/12/11 NNL Top 59. 02 > 50 MSI Sell 3. 948 > 3. 80 VIX Sell 18. 24 < 19 Top date 5/31/2011 NNL Top 49. 20 < 50 MSI Sell 3. 824 > 3. 80 VIX Sell 17. 95 < 19 2011 Buy signal 10/18/2011 All Clear = 2. 05 > 2 Pep Indicator = 4. 04% > 3. 8%
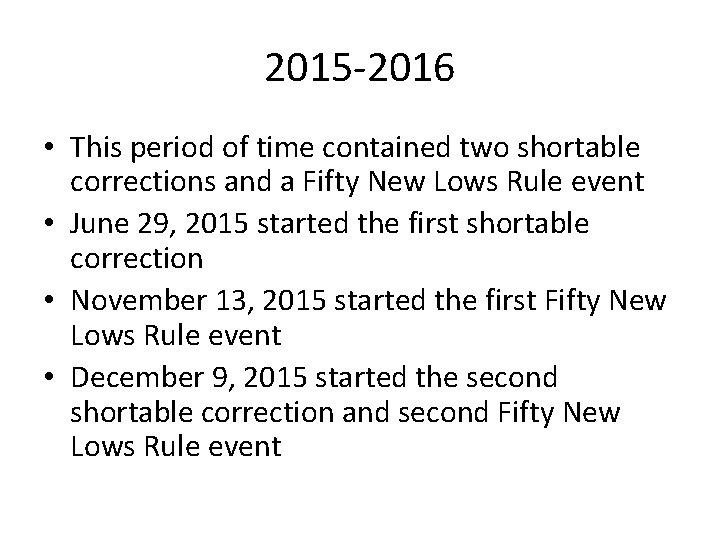
2015 -2016 • This period of time contained two shortable corrections and a Fifty New Lows Rule event • June 29, 2015 started the first shortable correction • November 13, 2015 started the first Fifty New Lows Rule event • December 9, 2015 started the second shortable correction and second Fifty New Lows Rule event
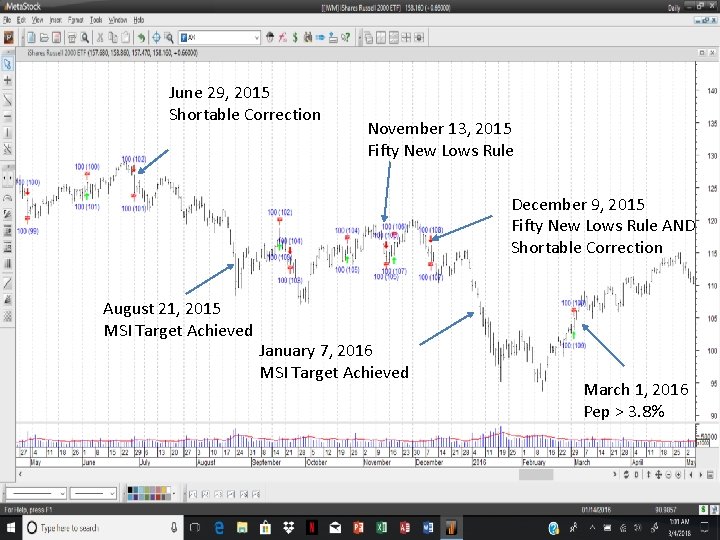
June 29, 2015 Shortable Correction November 13, 2015 Fifty New Lows Rule December 9, 2015 Fifty New Lows Rule AND Shortable Correction August 21, 2015 MSI Target Achieved January 7, 2016 MSI Target Achieved March 1, 2016 Pep > 3. 8%
- Slides: 72