Using HOBO data loggers with AirWaterSoil temperature probes

Using HOBO data loggers with Air/Water/Soil temperature probes to measure free-air temperature on high-altitude balloon flights Erick Agrimson St. Catherine University, St. Paul, MN epagrimson@stkate. edu James Flaten University of Minnesota and MN Space Grant, Minneapolis, MN flaten@aem. umn. edu

Abstract HOBO data loggers with Air/Water/Soil temperature probes are commonly used to measure atmospheric temperature during high-altitude balloon flights. Inconsistencies between results from sensors mounted in different ways and between results from a given sensor between ascent and descent confirm that there are many subtleties to making such a measurement properly. These may include, but are not limited to, (a) whether the sensors are exposed to the sun or shaded in some way, (b) where the sensors are physically located with respect to nearby payload boxes (and the color of those boxes), and (c) whether the sensors are surrounded by a thermal wake trailing below the balloon. We will present preliminary results from our investigation and suggest some “best practices” for using these user-friendly temperature sensors on missions to near-space.

Differences in Temperature One of the common features seen from high-altitude flights is a difference in free-air temperatures measured on ascent versus on descent. One expects the same temperature features should appear on descent as during ascent, but in reverse order (and possibly more quickly in time).

A typical free-air temperature data record from a high-altitude balloon flight.

Descent temperatures Ascent temperatures The same temperature data plotted against altitude instead shows this effect even more clearly.

HOBO Data Loggers: manufacturer specs According to Onset Computers, when used with U 12 HOBO data loggers the Air/Water/Soil temperature sensors have a range of -40° to 212°F (-40° to 100°C) in air, with an accuracy of ± 0. 45°F from 32° up to 122°F (± 0. 25°C from 0° up to 50°C), a resolution of 0. 05°F at 68°F (0. 03° at 20°C), and a response time of <3 min in 3 ft/sec (1 m/sec) air flow. Also “(a solar) radiation shield (is) strongly recommended for use in sunlight. ”

A 2 -channel HOBO U 12 data logger with an ext. temp. sensor and a solar panel attached.

A typical HOBO U 12 data logger installation with an ext. temp. sensor sticking outside the box.

HOBO operation at low temperatures and pressures Onset Computers does not make any claims about whether HOBO data loggers can operate in the low temperature, nearvacuum, and/or high (cosmic) radiation environments. We conducted a series of lab tests to study the performance of multiple HOBO U 12 data loggers and multiple Air/Water/Soil temperature sensors, with an eye toward their utility in nearspace. Our results suggest that HOBOs are effective even when they get moderately cold, down to about -4°F (-18°C). Our attempts to determine whether HOBOs are influenced by low pressure were inconclusive, but flight experience suggests that HOBOs can operate without any problems down to less than 1 psi.

Checking the calibration of multiple external temperature sensors.


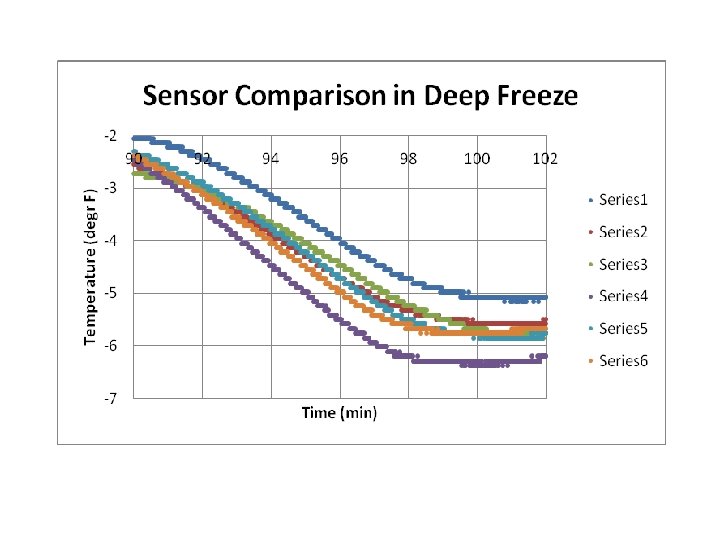
Variation in sensors The next slide shows how the readings on the 6 sensors in the configuration used for the wake boom flights compared when the set of sensors was put into a deep freezer. The variation among sensor readings at room temperature is about 0. 75°F
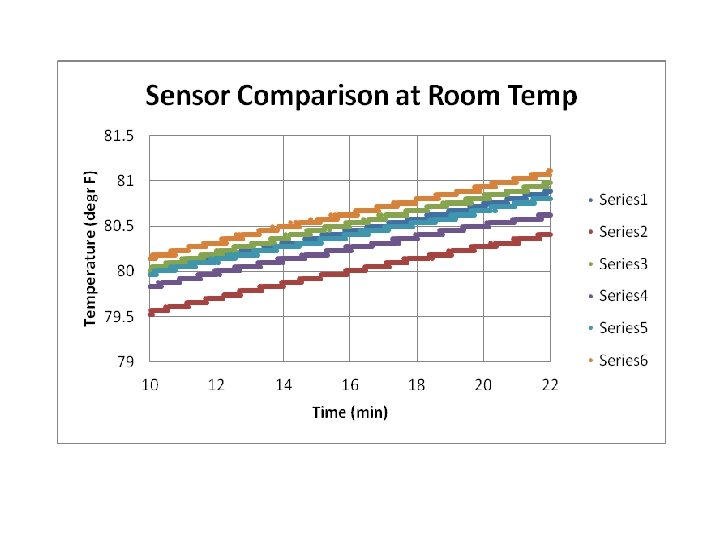

Freezer test and temp response The variation among sensor readings at freezer temperatures is about 2. 0°F Notice that the sensors take about 15 minutes to reach equilibrium after being subjected to a temperature drop of about 85°F. Temperatures change most rapidly, about 10°F to 15°F/min, during the early part of the descent. This data suggests that rate may be sensor-limited, and merits further experimentation. Notice that the warmest-to-coldest order of sensors is different at the two temperatures tested, from which we conclude that the calibration discrepancies for HOBO thermometers are temperature dependent.

Ground “Truth”: Sun vs Shade Ground tests comparing readings in the sun to those made in the shade suggest direct sun exposure (once equilibrium is reached) may produce an effect on the order of 6. 5°F (3. 6°C).
 of Sun shades of")
A device used to study the effect (on the ground) of Sun shades of various colors on ext. temp. sensors.

Sun Shade test We conducted one flight with a “multi-colored” payload which had exposed HOBO temperature sensors mounted near black and silver-colored walls, as well as sensors in sun shades a few inches and 20’ and 50’ below the payload. The results from this flight showed that a shaded sensor just below the payload was, on average, about 3. 0°F (1. 7°C) warmer than an exposed sensor at the same location, attesting to the influence of the warm shade and/or the warm payload box nearby. Near the peak of the ascent an exposed sensor just outside a black payload side grew in temperature relative to an exposed sensor outside a silver payload side until it was a full 10°F (5. 5°C) warmer, again attesting to the non-negligible impact of a nearby warm object.
 outside and below diff. colored")
A “multi-colored” payload with ext. temp. sensors (some shaded) outside and below diff. colored sides.

More Sun Shade tests As a portion of a University of St. Catherine class project in May 2012, sun shades were added to sensors that were then flown on two different flights. Students predicted that the effect of covering the sensor would not show a significant change in temperature. Data analysis revealed a significant effect (> 4° F difference in temperature between the covered sensor and uncovered sensor occurred - well outside of calibration differences of the sensors).

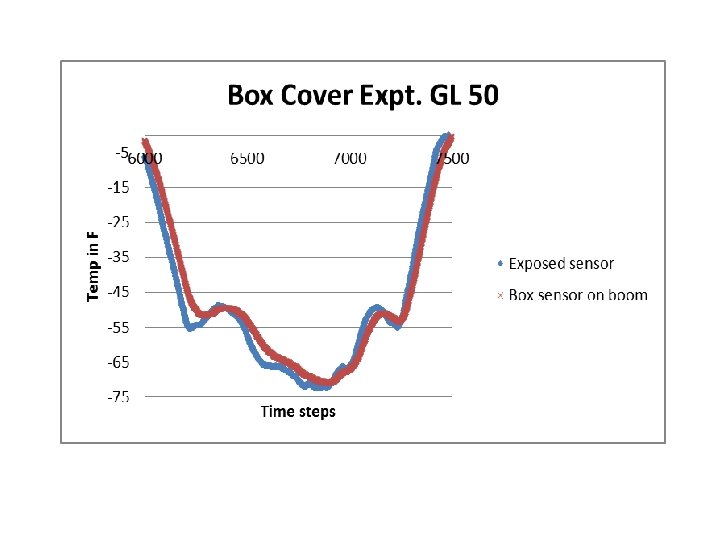
The St. Kates student payload with ext. temp. sensors, 2 exposed and 2 shaded (on boom vs next to wall).

Sun Shade data The data show the trend seen with boxes attached to the payload itself as well as isolating the box on a boom in that the box senor data indicates a warmer reading > 4°F as well as the box experiences a “time lag” measuring minima at a time later that seen by the exposed sensor. This trend holds also for daytime flights for which the sun shield was developed. The covered sensor has been warmer than the exposed sensor and tends to be so by at least 4°F in all of the flight data collected thus far.

The Thermal Wake Experiment: As described in the papers listed below, a thermal wake exists below an ascending balloon. • Tiefenau, H. and Gebbeken, A. Influence of meteorological balloons on Temperature Measurements with Radiosondes: Nighttime Cooling and Daylight Heating, J. Atmos. and Oceanic Tech. 6 (36 -42), 1989 • Ney, E. , Maas, R. and Huch, W. The measurement of atmospheric temperature, J. Meteor. , 18(60 -80), 1960 • Brasefield, C. J. , Measurement of air temperature in the presence of solar radiation, J. Meteor. , 5 (147 -151), 1948

Wake Theory Summary On a daytime flight the temperature of the air in a wake extending beneath the balloon will be warmer due to solar radiation hitting the balloon and this in turn affects the temperatures measured directly beneath the balloon. In addition to the daytime phenomena, an opposite effect has been shown to occur during night flights when the adiabatic gas temperature inside the balloon is lowered which then lowers the balloon skin temperature. The cool skin temperature of the balloon cools the air in the wake beneath the balloon, affecting measurements below the balloon. The effect in both the daytime and nighttime is said to be stronger with a decrease in air pressure as so we except to see more of an effect after the crossing of the tropopause boundary.

The “wake-boom” device, with ext. temp. sensors within the wake and extending outside of it too. Sensor A, 6 ft “far left” -60 in Payload Box with HOBO Sensor B, 1 ft “center” -3. 5 in Sensor C, 6 ft “center” +3. 5 in Total wake boom length is 114. 5 in Sensor E, 6 ft “mid-right” +34 in Sensor D, 6 ft “near right” +13. 25 in Sensor F, 6 ft “far right” +54. 5 in

The “wake-boom” device on a balloon stack.

Daytime wake data We noticed a difference in the temperature profiles especially towards the end of the accent of the balloon (the final seconds before burst showed the largest temperature differences between ext. temp. sensors inside and outside the wake).

Temperature vs time for the 6 ext. temp. sensors on the wake boom from the middle of a daytime flight.

Data analysis from a daytime flight A trend in both daytime flights was the presence of colder measurements by the far right and far left temperature probes – presumably in the area outside of the wake effect. Looking at the data it would appear that a cold region also exists near the payload box, that a warmer region is in the mid range area, and that the coolest measurements exist on the ends of the boom. Calibration may account for some of the warm region effects seen in the data in the middle and near temperature sensors. It is interesting to see a small difference in the measurements made by the 1 ft and 6 ft sensors on the payload. It appears that about a 1°F difference does occur between both of these sensors. Given that the distances from the center of the wake were exactly the same, we suggest that this difference is only related to differences in the sensors themselves.

Zooming in on the minutes just before burst, when the temp. differences were the greatest.

Night flight • Where is the wake effect?

Temperature vs time for the 6 ext. temp. sensors on the boom from the middle of a nighttime flight. The temp. continued dropping to burst at 65, 000 ft.

Nighttime flight results One should observe the “…effect of lower temperature readings during ascents than during descents …” In all of the wake experiments we seem to see all the sensors reach a common temperature (within 1°F) on decent under parachute, after the balloon has burst. Data from flight GL 50 indicates that the coolest region was at the far end of the boom, again with the center payload area also being located in colder region (but not as much as the ends) and the middle probes measuring the warmest. On this flight it appears that the middle right probe is reading “warmer” throughout the flight, but not to the extent it was during the GL 49 daytime flight.

Zooming in on the minutes just before burst, when the temp. differences were the greatest.

Summary HOBO U 12 data loggers with the air/soil/water sensors appear to be in agreement with the manufacturers specifications for “normal operating ranges”. We fly the sensors outside of the specified ranges but the results seem to indicate performance that is reasonable. The boxes and sensors themselves do have individual calibration offsets associated with them. These offsets are temperature dependent so trying to do calibration at a single temperature may be difficult. Individual channels on the box also have a small offset but it is well within the manufacturer’s range. One should take to time to understand the differences in each channel before making final conclusions about temperatures being measured in a certain channel with a certain sensor. We need to continue to study whether reduced pressure affects the functioning of HOBO data loggers.

Summary Continued HOBO data loggers are recommended to have sun shields placed near them. From our series of flights we concluded that a difference does occur with using sun shields. We recommend using both exposed and non-exposed sensors for measuring temperature. The exposed sensors appear to measure smaller changes in temperature variation much more so than the sunshielded sensors. A sun shield will cause sensor temperature measurements to lag those from exposed sensors. We also suggest experimenting with in a light coat of white paint to be applied to the sensor, versus the out-of-the box aluminum colored sensor. One also needs to be observant of the box color that is flown. For temperature measurements, a white or silver box is preferable (though a black box keeps itself warmer, of course). One also needs to be aware of the proximity of the sensor to the box. We have flow with temp. probes just barely poking outside of a payload wall – this is not recommended!

Summary Continued We feel that looking for thermal wake was a worthwhile endeavor. Preliminary results show a greater effect at lower pressures (i. e. above the tropopause), as suggested by one of the references, but more flights need to be conducted during both the daytime and the nighttime. If we construct another version of the boom, we may consider having more temp. sensors (higher spatial resolution) and possibly make a longer boom so we can clearly get outside the wake temperature gradient. We may also attempt some flights with a minimal load, so as to reach higher altitudes. (Note – our one night flight to date burst prematurely at only 65, 000 ft. ) At higher altitudes we hope the temperature difference effects may be even greater than those already observed.
- Slides: 38