Using Ground Based and in Situ Airborne Observations

Using Ground Based and in Situ Airborne Observations Collected during the CLARIFY 2017 and LASIC Field Campaigns to Explore Synoptic, Dynamical and Aerosol Constraints on Precipitation. Paul Barrett (Met Office) Steven Abel (Met Office), Jim Haywood (University of Exeter) Reed Hall, Exeter, 2018

Talk Outline 1. Vertical Profile: Decoupling 2. Aerosol, Cloud and Precipitation properties, in clean and perturbed regimes 3. Airborne and ground based observations: Next steps

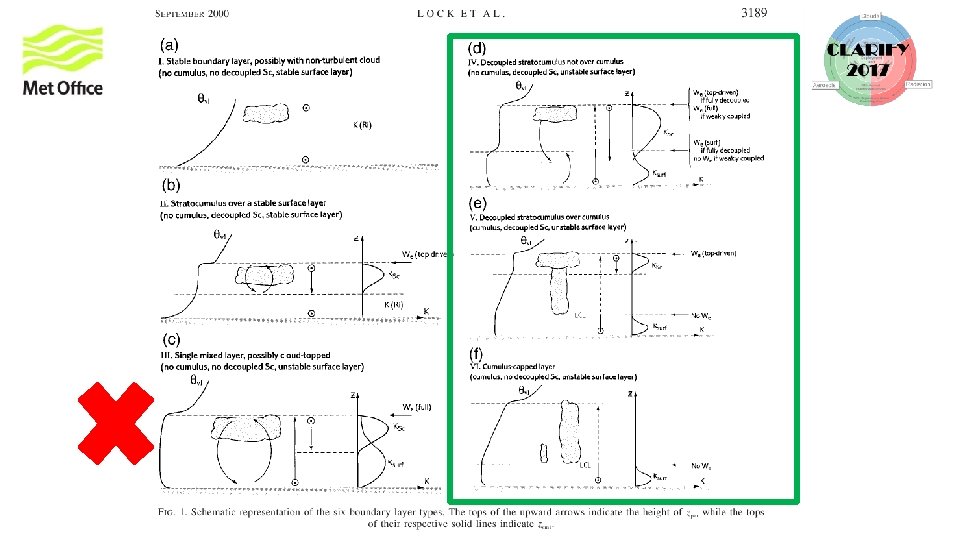
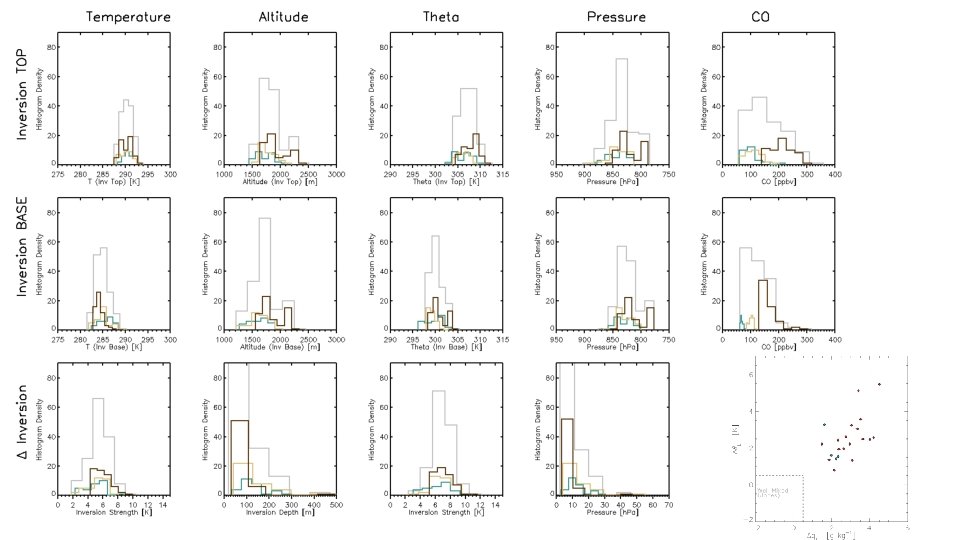
Mean Vertical Structure and Decoupling • Trade wind inversion at 2. 0 ± 0. 4 km • Humid layer in lower free troposphere • Can contain transported biomass burning aerosols • plume from continental Africa

Mean Vertical Structure and Decoupling • Trade wind inversion at 2 km • Humid layer in lower free troposphere • Can contain transported biomass burning aerosols • plume from continental Africa Boundary layer predominantly decoupled (Jones et al, ACP 2011 decoupling metric (VOCALS, SE Pacific)
")
Large Scale Statistics from FAAM Aircraft Data – Boundary Layer, All Flights (except POCs) • Paul Barrett (AMS Vancouver 2018) Boundary layer Carbon Monoxide is a tracer of airmass history.
")
Large Scale Statistics from FAAM Aircraft Data – Boundary Layer, All Flights (except POCs) And LASIC ARM site data • Boundary layer Carbon Monoxide is a • • Paul Barrett (AMS Vancouver 2018) tracer of airmass history. LASIC ARM site data for the same time period, 17 th Aug – 7 th Sept. Data not colocated ARM site measured similar range at Ascension, at 350 m altitude
")
Large Scale Statistics from FAAM Aircraft Data – Boundary Layer, All Flights (except POCs) And LASIC ARM site data • Boundary layer Carbon Monoxide is a • • • tracer of airmass history. LASIC ARM site data for the same time period, 17 th Aug – 7 th Sept. Data not colocated ARM site measured similar range at Ascension, at 350 m altitude Possibly some biases to explore? • Aircraft data are Tri-modal: • Low: oceanic Background • Moderate • Heavily Polluted Paul Barrett (AMS Vancouver 2018) 55 < clean < 78 83 < moderate < 116 126 < polluted < 185

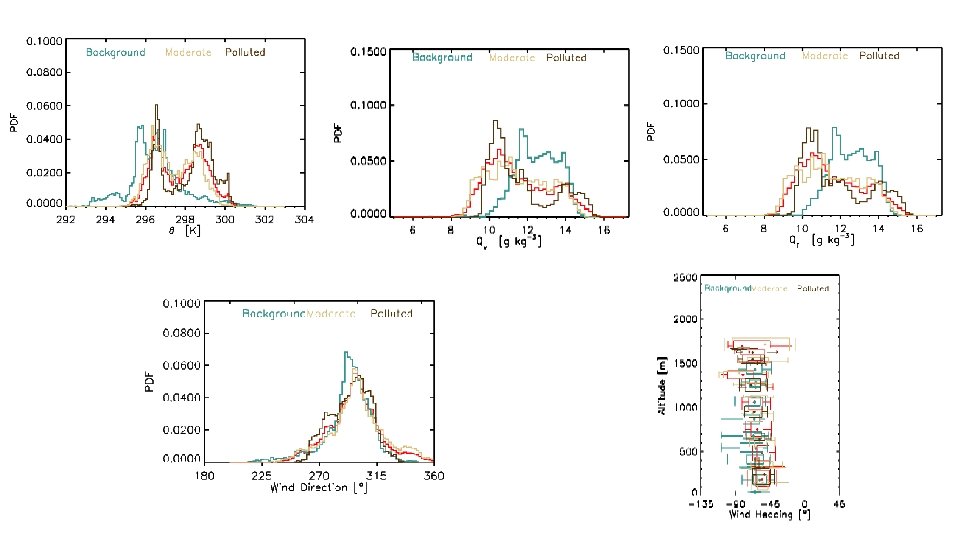
Aircraft data sampled three boundary layer regimes – Background, Moderate and Polluted Regimes distributed across the campaign – similar to the broad scale regimes. Model mmr (µg m-3) Paul Barrett (AMS Vancouver 2018)

Aircraft data sampled three boundary layer regimes – Background, Moderate and Polluted Regimes distributed across the campaign – similar to the broad scale regimes. Strongest pollution events tend to be higher in boundary layer- fresh entrainment? Model mmr (µg m-3) Clean background conditions are always below 1500 m Two stage mixing - through trade inversion Paul Barrett (AMS Vancouver 2018) - then to lower BL?

Mean Boundary Layer Aerosol Number and Cloud Droplet Number - In three regimes Strong microphysical change between background and polluted. • Non-linear once polluted • Clearly going to be Cloud Top Effective Radius impacts, • and hence indirect effect climate response to biomass burning aerosol in SE Atlantic • Still to quantify • can’t distinguish semi-direct effect in these observations, as separate from meteorology •
![Statistical [Hellinger] Distances Between Distributions “Moderate” and “polluted” are in fact statistically similar More](http://slidetodoc.com/presentation_image/001cf5948820631bb01a8a6a9d8dd869/image-12.jpg "Statistical [Hellinger] Distances Between Distributions “Moderate” and “polluted” are in fact statistically similar More")
Statistical [Hellinger] Distances Between Distributions “Moderate” and “polluted” are in fact statistically similar More similarity for drizzle properties Different …. . The Same …. .
![Statistical [Hellinger] Distances Between Distributions Define a “Perturbed” regime, with CO > 83 ppb](http://slidetodoc.com/presentation_image/001cf5948820631bb01a8a6a9d8dd869/image-13.jpg "Statistical [Hellinger] Distances Between Distributions Define a “Perturbed” regime, with CO > 83 ppb")
Statistical [Hellinger] Distances Between Distributions Define a “Perturbed” regime, with CO > 83 ppb Different …. . The Same …. .

Aerosol, Cloud and Drizzle properties in clean and perturbed conditions, • Drizzle particles – larger than 100 μm • Higher frequency of drizzle number concentrations in background regime • Controlled by aerosol impacts on cloud • The mass contained in the drizzle size range is more frequently higher in the background regime • Possibly should include CDP data (<50 micron) particles

Aerosol, Cloud and Drizzle properties in clean and perturbed conditions, including ground base radar LASIC: Ka. ZR
 above LCL, below")
Mean Boundary Layer Thermodynamics profiles Perturbed case: “Warmer” and Drier (qt) above LCL, below Trade inversion, Hence reduced RH, and higher cloud base Also – Deeper boundary layers, Statistically significant in aircraft obs? Perturbed boundary layer promotes stronger decoupling Tendency for: ~Surface Layer • more polluted regimes to be warmer, • indicative of the continental source from the east, c. f. the clean remote marine boundary layer from the south east • Upper boundary layer (above 500 m - above surface layer) is drier in polluted regimes – entrainment of free-tropospheric air? • Deeper boundary layers in polluted regimes? • Is entrainment more likely when the wind shear between BL and FT is low? • Also cloud cover properties…

Profiles of Boundary Layer Na, Nd, LWC in Clean and Perturbed Conditions - Profiles of aerosol cloud properties Perturbed clouds have higher bases, lower LWC (and presumably LWP), more (smaller) drops. Cloud top, and inversion top is higher altitude No low level cumulus sampled by aircraft in perturbed conditions – statistically robust? (no, but…)

LASIC Observations Jianhoa Zhang, Paquita Zuidema Broadly similar picture, with added diurnal capability

LASIC Observations Jianhoa Zhang, Paquita Zuidema Aircraft didn’t sample diurnal cycle

LASIC Observations Jianhoa Zhang, Paquita Zuidema Aircraft didn’t sample diurnal cycle

Pristine Background θ ΔθTI Aircraft samples full range of conditions as epr LASIC, and can add cloud and aerosol properties Perturbed θ ΔθTI ZBL ZBL Marine background NA < 100 cm-3 , Larger particles near surface Well mixed to LCL No or limited smoke / CO LCL Next Steps: Determine BL heating rates from aerosol PSD (also size distribution tomorrow) Polluted / Perturbed 100 < NA < 1000 cm-3 , Pollution strongest towards top of BL, under trade inversion Recent entrainment event? Long time since entrainment allows for mixing throughout BL. Smoke, CO
 and")
NEXT STEPS • • • Inversion Properties, cloud boundary investigations Aerosol PSD (tomorrow…) and heating rates, then: Cloud / Drizzle properties in pristine, and perturbed cases LES studies, either internally, or with US groups. ARM site LWP data, categorised by regime Targeted MARSS retrievals for clean / perturbed, looking up through cloud cases?

Conclusions • The Boundary Layer pristine background regime was frequently perturbed by smoke intrusions from the free troposphere • Aerosol, cloud and thermodynamic properties fall into two categories, pristine, and perturbed • Need to disentangle Aerosol direct and semidirect effects from meteorology – scanning radar? , LES Data were obtained from the Atmospheric Radiation Measurement (ARM) User Facility, a U. S. Department of Energy (DOE) Office of Science user facility managed by the Office of Biological and Environmental Research.

Aerosol Particle Size Distribution PCASP calibrations

Particle Size Distributions Within the boundary layer – check for cloud contamination PCASP – Clean has RI=1. 37, vaguely sea salt, Am. Sulphate. PCASP –Polluted, includes moderate and dirty cases, and RI =1. 51+i 0. 0029 Plotted for upper and lower Boundary layer (400 m layer) PCASP measures dry size anyway. Dips in BOTH RI for both instruments ranges suggests an instrument “feature” – How to correct for this, smooth across even more? Both instruments look similar Where is the mode? More, larger high level pollution Less clean high level sea salt, both sensible Fits to follow next week Δ

Particle Size Distributions Within the boundary layer – check for cloud contamination PCASP and CDP in aerosol regimes Determined when Nevzorov LWC (1) is below 1 e-2 Could do a better flag perhaps – but looks to be responding as expected. Have new bin dimensions from Kate Szpek for PCASP using 1. 59+0. 029 i from Fanny Peers. Looks sensible compared to my calcs using Phil R Mie code. Probably only valid for the submicron stuff in polluted cases where it is likely to be mostly biomass. Probably sea-salt above 1 micron, in all cases. Pristine case looks to be bi-modal and yhas

Bin Dimension Files /net/spice/project/obr/CLARIFY/pcasp_bins_P 1 P 2_20170919_ks_pb_v 1. csv /net/spice/project/obr/CLARIFY/pcasp/P 1_20170919_ri 151_0029 i_25 bins_L 1 A_cal_adj_smoothbox. nc PCASP Bin Edges. /net/spice/project/obr/CLARIFY/pcasp/P 2_20170919_ri 151_0029 i_25 bins_L 1 A_cal_adj_smoothbox. nc Exclude lower bin, bin 0 Merged bins across gain stages: 4, 5, 6, 14, 15, 16 data produced by KS file prodcued my PB contact: paul. barrett@metoffice. gov. uk Bins dimensions for sub-micron for PCASP 1, PCASP 2 Using the post-CLARIFY calibration on 20170919 These both look self-similar The other two (pre-CLARIFY) look different (Dodgy? ) Differences are of the order 20% below 0. 3 μm, 40% below 0. 6 μm, Double above 0. 7 μm. P 1_20170919, P 2_20170919 0. 1255, 0. 1274 0. 1344, 0. 1405 0. 1402, 0. 1484 0. 1622, 0. 1745 0. 1714, 0. 1836 0. 1808, 0. 1930 0. 2001, 0. 2130 0. 2201, 0. 2344 0. 2413, 0. 2572 0. 2635, 0. 2813 0. 2869, 0. 3070 0. 4625, 0. 5966 0. 5724, 0. 7345 0. 8809, 1. 0950 1. 1269, 2. 0673 1. 9155, 2. 7495 2. 5553, 3. 3067 2. 8956, 3. 8126 3. 4280, 4. 7423 4. 0609, 5. 6135 5. 2224, 6. 6186 6. 1525, 7. 6032 7. 0447, 8. 5282 7. 8471, 9. 3015 8. 6721, 10. 148

Inversion Properties Cloud Boundaries

Inversion Boundaries, Cloud Boundary, Lidar
 and")
PCASP 1 Post-cal, 20170919 Bins for PCASP from PB (using PR Mie code) and KS (using KS Mie code) for RI = 1. 51 + i 0. 0029 (from Fanny Peers) Only few-% difference sub-micron Needs explaining later but not huge… Super-micron – larger, 15%, but don’t expect to see biomass here anyway

What time of day did we sample three regimes? Spread around throughout the day. Paul Barrett

Large Scale Statistics Three Regimes • Opportunistic targeting of regimes depending on daily conditions • Where are the • Low: oceanic Background • Moderate • Heavily Polluted Ascension Island Paul Barrett (AMS Vancouver 2018)
 |")
Correlations Na | Delta. BL_Theta 0. 190231 Theta | Ndriz -0. 328314 Theta(top) | Ndriz 0. 0410258 Theta(base) | Ndriz -0. 565837 Theta(delta) | Ndriz 0. 265200 Nd | Ndriz -0. 530436 wa | Ndriz -0. 151701 ws | Ndriz -0. 241473 wa(FT) | Ndriz 0. 207160 ws(FT) | Ndriz 0. 221640 wa(top) | Ndriz 0. 0284230 WA Shear(BL) | Ndriz 0. 0431181 WA shear (FT)| Ndriz 0. 161441 ws SHEAR (BL)| Ndriz 0. 167460 ws SHEAR (FT)| Ndriz 0. 306303 Qv. Delta. BL | Theta. Delta. BL 0. 535373 Qt DElta. BL | Theta. Delta. BL 0. 568714 N driz | Qt DElta BL 0. 252545 Na Na(top) Na(base) co co co co co | Ndriz -0. 565368 | Ndriz -0. 618229 | Ndriz -0. 263098 | Na 0. 777072 | Na(top) 0. 715818 | Na(base) 0. 0370803 | Nd 0. 651854 | Ndriz -0. 411294 | Theta. BL 0. 708556 | Theta. TOP 0. 633245 | Theta. BASE 0. 166799 | Delta. BL_Theta 0. 498139 | Qv 0. 117416 | Qv. TOP -0. 125509 | Qvbase 0. 532186 | Qv. Delta -0. 606848 | Qt 0. 138398 | Qt. TOP -0. 0824605 | Qtbase 0. 532226 | Qt. Delta -0. 566172
- Slides: 35