Using FME To Efficiently Create NationalScale Vector Contours


 § Fitness for Purpose is a key consideration: § Lambert Conformal")


")

- Slides: 25
Using FME To Efficiently Create National-Scale Vector Contours From High. Resolution DEM Data Todd Lewis President, Terra. Logik. com
Outline § § § Intro Problem Description Technical Issues Solution Approach w/ Demo Workspaces Q&A 2
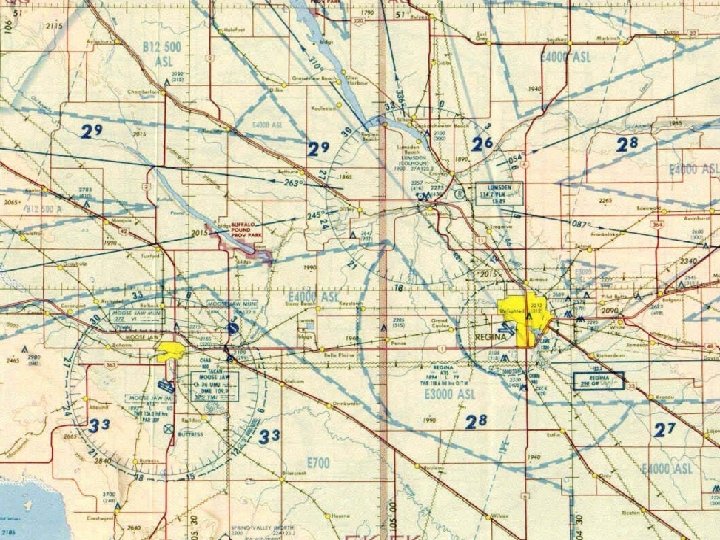
Introduction § NAV CANADA produces navigation charts for general aviation (Visual Flight Rules Navigation Charts – VNC) § Charts are used in visual conditions (3 -5 nautical miles visibility) § Charts are based upon standards set by the UN International Civil Aviation Org (ICAO) in Montreal § Terra. Logik designed the processes and procedures for topographic data supporting the VNC 3
Hurry up Jake! Turn the prop and get in! The owners are coming!!! 4
Problem Definition § VFR Navigation Charts series composed of 52 charts covering the Canadian Territory, and 7 Terminal Area Charts. § VNC series contains 70+ layers of topographic information from multiple sources. § ICAO specifications provide guidelines on how to depict each layer of information. § Application of ICAO guidelines is inconsistent across the entire VNC series. 5
Problem Definition (2) § Fitness for Purpose is a key consideration: § Lambert Conformal Projection to enable accurate greatcircle distance/bearing calculations § Obstacle and terrain avoidance § Cartographic considerations such as labeling, feature context, scale, etc. § Visual reference for navigation in-flight for ground -based features, primarily: § § § Water Roads/rail Utilities Landforms Built-up areas and remote buildings/structures 6
Our Approach § Standardize the depiction and cartographic rules to consistently present VNC terrain data across the entire chart series. § Develop automated processes to do the heavy lifting in application of cartographic rules to create a chart. § Document procedures and workflows to enable production operators to perform their work within an ISO 9002 environment. 7
Deliverable : Terrain Data File § Produce a Terrain Data File with agreed-to: § Format (# files, depictions, settings, etc. ) § Structure (level names, order, content/level) § Content (level of detail to show, rules) § Document procedures and workflows for production of charts using ETL and CAD tools § QA/QC checklists and manual editing procedures to clean-up Terrain Data File before passing to aeronautical information integration and prepress finishing procedures 8
Terrain Data File
Topographic Data File
Labels Data File
Hypsometry Data File
Shaded Relief Data File
Elevation Technical Issues § Contour and hypsometry required at 500 -ft intervals § Elevation data not consistently available at 1: 50, 000 -scale across Canada § Integration with US data at border areas § US data available at 1” below 49, and 2” in Alaska § Source data is CDED 1: 50 K, 1: 250 K, ASTER GDEM, and USGS DEM 15
Red is missing CDED data. Elevation data, where missing, will be populated using NASA ASTER data. Charts Affected by Elevation Issues: Alert Hazen Strait ere E m lles • Alert • Ellesmere • Devon Island • Baffin Bay • Cumberland Peninsula • Frobisher Bay • Ungava • Foxe Basin • Inukjuak • Coats Island • Baker Lake • Boothia • Resolute • Banks Island • Hazen Strait • Mackenzie Delta • Amundsen Gulf • Cambridge Bay • Klondike • Great Bear Lake • Bathurst Inlet • Rankin Inlet • Yellowknife • Fort Simpson • Kitimat • Anticosti a sk la A n Ban Devo Ma ks I Resolute d s ck Islan e De nz Am Bay und lta ie n i f sen n af Gulf rla la ia B h e t Kl o C a o mbridge B b su on um nin dik G B C a y W e rea e e hi t Be Fox in d P te a r Bathurst Lak as h r e aker Lk B e ors B he s Inlet i b Fo Fro Bay Sim rt pso Y At a n ellowkn s Is. lin av ife Rankin Coat g y Un Inlet For Ba k e a t s ju Ne lso Lake oo i Inuk W G ol n la st st Kit on udson Athab o h H im c asca i us Lake at nt ab Bay r Prin A W es de m a n Geo ce J ut rge Ed Ga Big Tro i Bay mont m i on Flin Flon Lake Va ut nco ico h n uv to ins. C er Cal c m r gar on hunde Tim y l. M Regina Winnipeg T Bay a e ntr o e i M Sault Ste. Mar o ont Tor y w H 16
Data Mismatch Canadian Elevation Data Missing Data CAN/US Border USGS Elevation Data 17
Software Limitations § Each VNC Chart is composed of 350 -400 1: 50, 000 CDED tiles § GIS & RS tools could create contour lines, but determining hypsometric tint requires polygon fills § Chart borders present issues with polygonizing contours § Volume of data presents huge challenges for processing and visualization 18
Requirements § Need to create: § Hypsometric Polygons at 500’, 1000’, 2000’, 3000’, 5000’, 7000’, 9000’, 12000’ § Contours @ 500’ intervals <= 4000’ § Contours @ 1000’ intervals > 4000’ § 350 -400 1: 50, 000 tiles per chart § Contours, hypsometry, spot elevations, and the shaded relief need to align 19
Solution Ingredients § § § § Transformer Loop Raster. Expression. Evaluator Transformer GDAL for raster-to-vector conversion Python. Caller for coding GDAL Workspace. Runner Generalizer Throw in some algorithms to: § Select significant contours for print scale: § Area/Perimeter > Tolerance 20
Process: Tiles First § Break raster into one band per contour interval (1 -18 bands total per tile) § Batch process the above with Workspace. Runner Synchronous/Async: § Time w/o Async: 20 hours § Time w/ Async: 1. 5 hours § Convert each band into a vector polygon layer § Use Python. Caller and GDAL to perform raster-to-vector conversion 21
Process: Merge & Generalize § Dissolve all polygons grouped by elevation level (500, 1000, 1500, …) § But need to look for depressions, Donut. Hole. Extractor § But need to densify for generalization § Generalize § Look for generalization errors, polygons w/ Na. N for area are errors to be logged § Evaluate for print scale using algorithm: § Area/Perimeter > Tolerance (0. 0005 or 0. 001) 22
Process: Symbolize Select Hypsometry values Remove depressions from hypsometric levels Convert all polygons to contour lines Change depression contours to normal contours if on hypsometry level § Output hypsometry and contours to Microstation levels with symbology from seed file § § 23
Example Output (false color)
Questions? Todd Lewis President Terra. Logik Information Systems Inc. T: 613. 862. 0999 E: todd. lewis@terralogik. com