Using Designing Presentation Aids CAS 100 Furness Presentation


 Maps")

 = Bar graph Uses vertical or horizontal bars of varying lengths")

 = Pie charts Depicts division of whole into slices")
 = Pictogram Picture symbols illustrating relationships and trends. When")
 = Flowchart Diagrams progression of a process")
 = Table (tabular chart) Systematically groups data in column")


 = Use standard upper- and lowercase")

- Slides: 20
Using & Designing Presentation Aids CAS 100 Furness
Presentation Aids = Benefits Help listeners process and retain information Convey information in a time-saving fashion Enhance an image of professionalism Can spark interest Can make a speech memorable
Select an Appropriate Aid = Types of presentation aids: Objects and models Pictures, graphs, and charts Audio, video, and multimedia = Should help listeners grasp information effectively
Props and Models = Prop Can be inanimate or live object Captures audience’s attention Illustrates or emphasizes key points = Model Three-dimensional, scale-sized representation of an object = When using a prop or model Keep it hidden until time for use; Make sure it is large enough; Practice your speech using it.
Pictures = Examples: Photographs and posters Line drawings Diagrams (schematic drawings) Maps
Graphs = Line Graphs Points connected by lines Demonstrates how something changes
Graphs (cont. ) = Bar graph Uses vertical or horizontal bars of varying lengths Compares quantities or magnitudes May be arranged vertically or horizontally
Guidelines for Graphs = When creating line and bar graphs Label both axes; Start the numerical axis at zero; Compare only like variables; Include no more than two lines of data per line graph Cite your source data
Graphs and Charts (cont. ) = Pie charts Depicts division of whole into slices Each slice represents a percentage When creating pie graphs: 1) Use no more than seven slices; 2) Represent and identify values accurately; 3) Cite your source data.
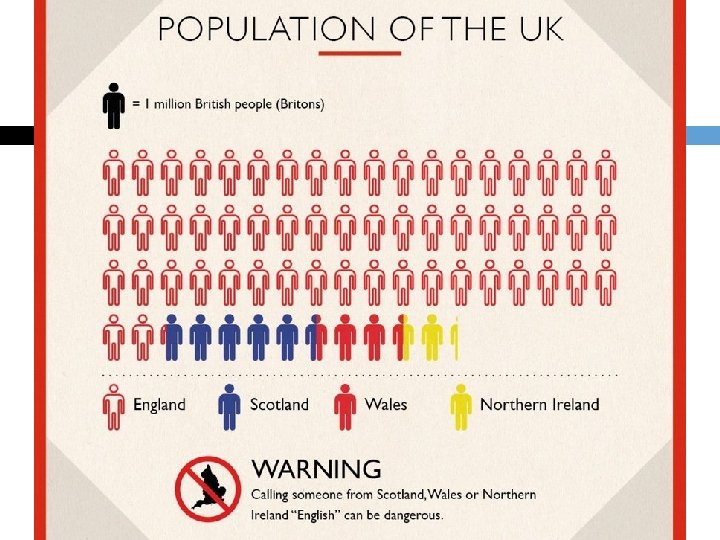
Graphs and Charts (cont. ) = Pictogram Picture symbols illustrating relationships and trends. When creating pictograms: 1) Clearly indicate what it symbolizes; 2) Make all pictograms the same size; 3) Label/cite info.
Graphs and Charts (cont. ) = Flowchart Diagrams progression of a process
Graphs and Charts (cont. ) = Table (tabular chart) Systematically groups data in column form
Audio, Video, and Multimedia = Audio Short recording of sounds/music/speech Can enliven certain presentations = Video Movie, television, and other recording instruments Introduce, transition into, and clarify points = Multimedia Combines still, sound, video, text, data Requires much more planning Requires familiarity with presentation software programs
MOST IMPORTANT! The most important things to consider when utilizing visual aids in a speech are these: = Don’t allow them to dominate your speech = Keep the focus on your words & ideas = Use sparingly = Have everything ready to go on a flash drive. There is no time for accessing materials via email or the internet.
Keep the Design Simple = Follow the six-by-six rule: Limit to six words per line Limit to six lines per slide = When using text Use active verb form; Use parallel grammatical structure. = Create concise titles that Tell viewers what to look for; Reinforce your message. = Allow plenty of white space. Provides “visual breathing room”
Use Design Elements Consistently = Follow consistent design decisions for presentation aids. = Consistency helps prevent distraction. = Use consistent design elements in each aid.
Select Appropriate Typeface Styles and Fonts = Typeface Specific style of lettering Two major categories Serif (include small flourishes) Sans serif (more blocklike/linear) = Check lettering for legibility. Take audience’s distance into consideration. = Lettering should stand out from background. = Use a familiar typeface. Should be easy to read Should not be distracting
Select Appropriate Typeface Styles and Fonts (cont. ) = Use standard upper- and lowercase types. Easier to read than all capitals = No more than two complementary typefaces Or use one typeface throughout = Use boldface, underlining, and italics sparingly.
Use Color Carefully = Used effectively, color can Set the mood of a presentation; Make things easier to see. = Poor color choices can Set the wrong mood; Render images unattractive or unreadable. = Keep background color constant on slides. = Limit use to two or three colors. Use contrasting colors for type and graphics. Stay within the same family of hues.