USING DATA FROM THE FEDERAL STATISTICAL AGENCIES TO


")
, Ohio, 2003 -2009 http: //tonto.")
 450 400 350")


 1999 Michigan 1999 Ohio 2000 Michigan 2000 Ohio 2001")
")


- Slides: 35
USING DATA FROM THE FEDERAL STATISTICAL AGENCIES TO INSPIRE STUDENTS CAUSE webinar, Nov. 10, 2009 Ron Wasserstein Executive Director, The American Statistical Association
Goals for this presentation �Inform you about the role and scope of the federal statistical agencies �Inspire you to explore a rich source of data to inspire your students
Observations from many discussions with federal statisticians � An incredible array of data is collected by the federal government � Government statisticians are deeply invested in the quality of their data � They are open to the assessments of others to help improve quality and usability � Their methods are transparent � They want the data to be used (not collected for its own sake)
Federal Statistical System �A vast decentralized system of agencies and departments within agencies � Fifteen agencies make up the “principal statistical agencies, ” and collaborate via the Interagency Council on Statistical Policy (ICSP) � Katherine Wallman, former ASA President, is the Chief Statistician of the United States (OMB)
Principal Statistical Agencies � Bureau of Economic Analysis http: //www. bea. gov/interactive. htm Bureau of Justice Statistics http: //www. ojp. usdoj. gov/bjs/ Bureau of Labor Statistics http: //www. bls. gov/data/ Bureau of Transportation Statistics http: //www. bts. gov/data_and_statistics/ Census Bureau http: //www. census. gov/main/www/access. html, � Economic Research Service, Dept of Agriculture � � http: //dataferrett. census. gov/ http: //www. ers. usda. gov/Data/ Energy Information Administration http: //www. ers. usda. gov/Data/ � Environmental Protection Agency http: //www. epa. gov/epahome/data. html, � http: //www. epa. gov/oar/airpolldata. html, http: //www. epa. gov/triexplorer/ � Internal Revenue Service, Statistics of Income http: //www. irs. gov/taxstats/index. html � National Agricultural Statistics Service, http: //www. nass. usda. gov/Data_and_Statistics/Quick_Stats/index. asp � National Center for Education Statistics, http: //nces. ed. gov/datatools/, � National Center for Health Statistics � National Science Foundation, Science Resources Statistics, � Office of Management and Budget, http: //nces. ed. gov/nationsreportcard/naepdata/ (explore NAEP data) http: //www. cdc. gov/nchs/data_access/datatools. htm, http: //www. cdc. gov/nchs/Vital. Stats. htm http: //www. nsf. gov/statistics/database. cfm
Three data “warehouses” �dataferret. census. gov �www. fedstats. gov �www. data. gov
So there’s a lot of data out there… � It is primarily designed to provide information to policy makers and to the public � As such it is not always in a format that makes it easy to use for classroom purposes � However, there is increasing interest in making classroom-ready materials. � Much of the data is tabular, but there is also plenty of micro-data at varying levels of complexity
Accessing this data is a lot like riding a roller coaster, says the EPA’s David Mintz: �There is great anticipation at the beginning �The middle can be a little scary �If you don’t throw up, the end is quite rewarding.
What can we do with this data? �Illustrate basic concepts with data students care about �Discuss difficulties associated with good data collection �Interesting and relevant examples for class, homework, projects, exams �Convince students of relevance of our discipline �(Perhaps, and where appropriate) connect to students’ interests in societal concerns
Data always have limitations DATA IN USE. Proceed with understanding.
Let’s teach “Responsible skepticism” Ignorant skeptic Responsibl e skeptic
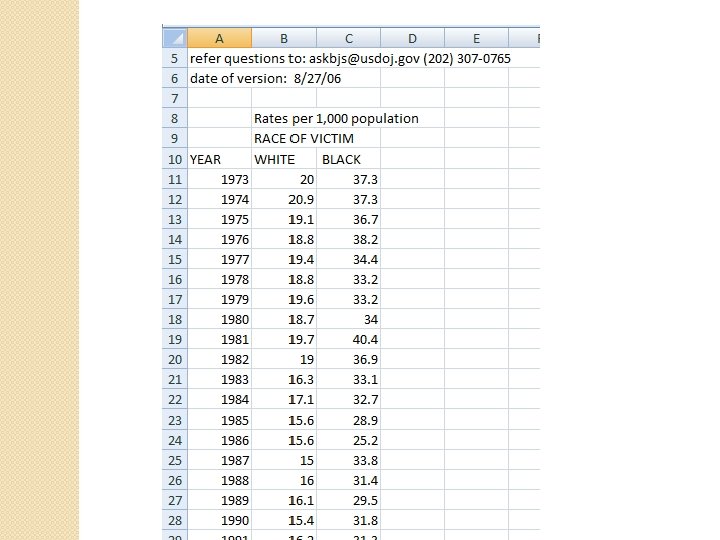
Some examples - BJS
http: //www. ojp. usdoj. gov/bjs/glance/race. htm
http: //www. ojp. usdoj. gov/bjs/glance/tables/racetab. ht m
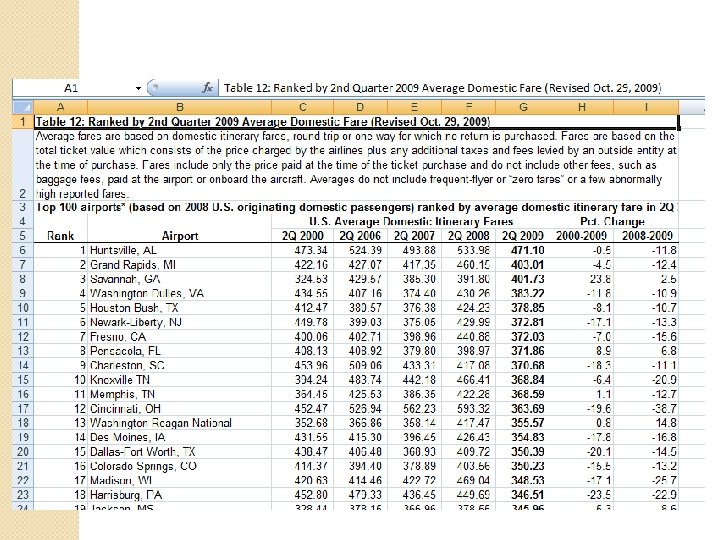
Bureau of Transportation Statistics
http: //www. bts. gov/programs/economics_and_finance/air_travel_price_index/html/table_12. ht ml
http: //www. bts. gov/xml/atpi/src/result. Top 100. x ml
Average adjusted gross income of the top 400 US individual taxpayers, 1992 -2006 (in $1000) http: //www. irs. gov/taxstats/article/0, , id=203102, 00. html
Not made it into the top 400 yet? �Don’t feel too bad. Few stay there once they do! �Only about 27% made the list more than once in the last 15 years, and only about 15% made it more than twice. �http: //www. irs. gov/pub/ir s-soi/06 intop 400. pdf
Distribution of adjusted gross income, individual taxpayers, 2006 (percentages are estimates based on samples) http: //www. irs. gov/pub /irs-soi/06 in 11 si. xls No. of returns % of total cumulative % of total 2, 675, 594 1. 93% $1 under $5, 000 11, 633, 370 8. 41% 10. 34% $5, 000 under $10, 000 11, 786, 747 8. 52% 18. 86% $10, 000 under $15, 000 11, 711, 680 8. 46% 27. 32% $15, 000 under $20, 000 10, 937, 694 7. 90% 35. 22% $20, 000 under $25, 000 9, 912, 261 7. 16% 42. 38% $25, 000 under $30, 000 8, 749, 761 6. 32% 48. 71% $30, 000 under $40, 000 14, 151, 824 10. 23% 58. 93% $40, 000 under $50, 000 10, 687, 193 7. 72% 66. 65% $50, 000 under $75, 000 18, 854, 917 13. 62% 80. 28% $75, 000 under $100, 000 11, 140, 408 8. 05% 88. 33% $100, 000 under $200, 000 12, 088, 423 8. 73% 97. 06% $200, 000 under $500, 000 3, 121, 485 2. 26% 99. 32% $500, 000 under $1, 000 589, 306 0. 43% 99. 74% $1, 000 under $1, 500, 000 150, 431 0. 11% 99. 85% $1, 500, 000 under $2, 000 64, 007 0. 05% 99. 90% $2, 000 under $5, 000 98, 724 0. 07% 99. 97% $5, 000 under $10, 000 24, 975 0. 02% 99. 99% $10, 000 or more 15, 956 0. 01% 100. 00% No adjusted gross income 138, 394, 754 100. 0
Average weekly retail price of gasoline (cents per gallon), Ohio, 2003 -2009 http: //tonto. eia. doe. gov/dnav/pet_pri_gnd_dcus_soh_w. htm 450 400 350 300 250 200 150 100 May 26, 2009 May 26, 2008 May 26, 2007 May 26, 2006 May 26, 2005 May 26, 2004 0 May 26, 2003 50
Gas prices, Ohio & Florida, 2003 -2009 (blue line is Ohio) 450 400 350 300 250 200 150 100 50 0 May 26, 2009 May 26, 2008 May 26, 2007 May 26, 2006 May 26, 2005 May 26, 2004 May 26, 2003
Where do they get this stuff? � http: //www. eia. doe. gov/pub/oil_gas/petroleum/survey_forms/eia 878 f. pd f � http: //www. eia. doe. gov/oil_gas/petroleum/data_publications/wrgp/samp ling_methodology. html � Every Monday, retail prices for all three grades of gasoline are collected by telephone from a sample of approximately 900 retail gasoline outlets. The prices are published by 5: 00 P. M. Monday, except on government holidays, when the data are released on Tuesday (but still represent Monday's price). The reported price includes all taxes and is the pump price paid by a consumer as of 8: 00 A. M. Monday. This price represents the self-serve price except in areas having only full-serve. The price data are used to calculate weighted average price estimates at the city, state, regional and national levels using sales and delivery volume data from other EIA surveys and population estimates from the Bureau of Census.
Ohio vs. Michigan in… �Annual turkey production
State Number Raised (thousand head) 1999 Michigan 1999 Ohio 2000 Michigan 2000 Ohio 2001 Michigan 2001 Ohio 2002 Michigan 2002 Ohio 2003 Michigan 2003 Ohio 2004 Michigan 2004 Ohio 2005 Michigan 2005 Ohio 2006 Michigan 2006 Ohio 2007 Michigan 2007 Ohio 2008 Michigan 2008 Ohio 2700 4700 3500 4400 4500 4800 5700 4900 5500 4900 5800 4600 6000 4700 5800 5100 6000 4800 6000 Year Pounds Produced (thousand Price per pounds) Unit ($/lb) Value of production ($1, 000) 85590 172020 119000 165000 162000 181440 179520 218880 187180 212300 183750 219820 172500 223800 178600 216920 191760 227400 0. 41 0. 35 0. 34 0. 36 0. 35 0. 34 0. 39 0. 37 0. 42 0. 37 0. 44 0. 39 0. 43 0. 46 35, 092 60, 207 40, 460 59, 400 56, 700 63, 504 62, 832 76, 608 63, 641 82, 797 67, 988 92, 324 63, 825 98, 472 69, 654 93, 276 88, 210 104, 604 230400 0. 58 133, 632
Which state raises the most turkeys? (www. ncturkeyfestival. org)
Another Ohio vs. Michigan comparison http: //www. eia. doe. gov/cneaf/electricity/esr/table 5. html Average Monthly Consumption (k. Wh) Average Retail Price (Cents per Kilowatthour) 19, 558, 522 830 9. 74 $80. 84 IL 5, 065, 123 790 10. 12 $80. 01 IN 2, 727, 752 1, 058 8. 26 $87. 44 MI 4, 298, 455 686 10. 21 $70. 02 OH 4, 894, 635 926 9. 57 $88. 60 WI 2, 572, 557 725 10. 87 $78. 75 Census Number of Division State Consumers East North Central Average Monthly Bill (Dollar and cents)
From NHANES food security questionnaire Real questions, real data about real issues
Social Security data http: //ssa. gov/policy/docs/statcomps/supplement/2008/3 e. html#table 3. e 2
Social Security data http: //ssa. gov/policy/docs/statcomps/supplement/2008/5 a. html#table 5. a 1
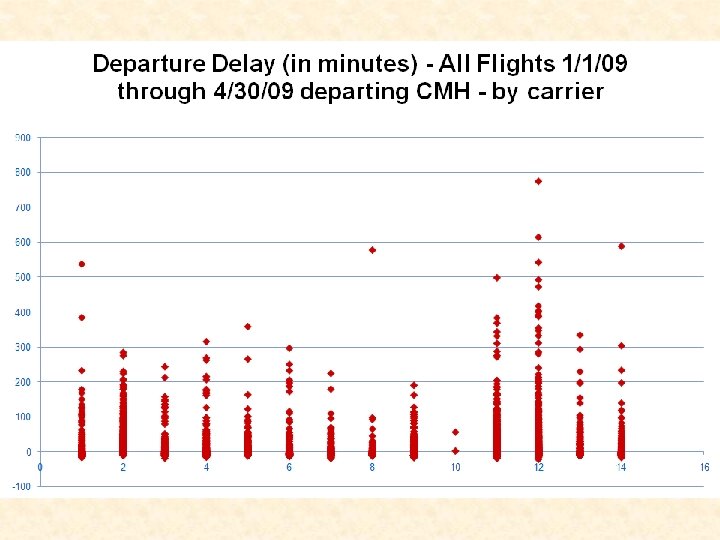
N S W W D L A A U S A k y W e s t U S A i r A m e E r x i p c J a e n t E a g l e C o m a i r A i r t r a n
I’m just wondering… �If our students are asking “When will I ever use this stuff? ”, is it possible we’re showing them the wrong stuff?