Using Concept Maps to Organize Reviews of Literature


 Blue- Quantitative")


- Slides: 14
Using Concept Maps to Organize Reviews of Literature For CAUSE Research Clusters Hollylynne Lee April 6, 2010
Goals of a Literature Review • Getting familiar with research and best practices in area of interest • Extracting salient findings that seem interesting/important to the area of interest. • Synthesizing salient findings • Constructing a written document that presents the synthesis to provide: – relevant background for those interested – an argument for a proposed research study (gaps in research, research methods, populations of interest)
What is a “concept” map? • A diagram to represent relationships among concepts or topics. – Concept map —structure of how different ideas are related through linking phrases. – Topic map– structure of how different topics are related and indicates how/where/when those topics occur – Mind map- radial hierarchical or tree branch organization to help understand one central idea.
Concept Map showing linking phrases http: //en. wikipedia. org/wiki/Concept_mapping
Topic map showing associations and occurrences http: //en. wikipedia. org/wiki/Topic_map
Mind map showing branches from central idea http: //en. wikipedia. org/wiki/File: Mind. Map. Guidlines. JPG
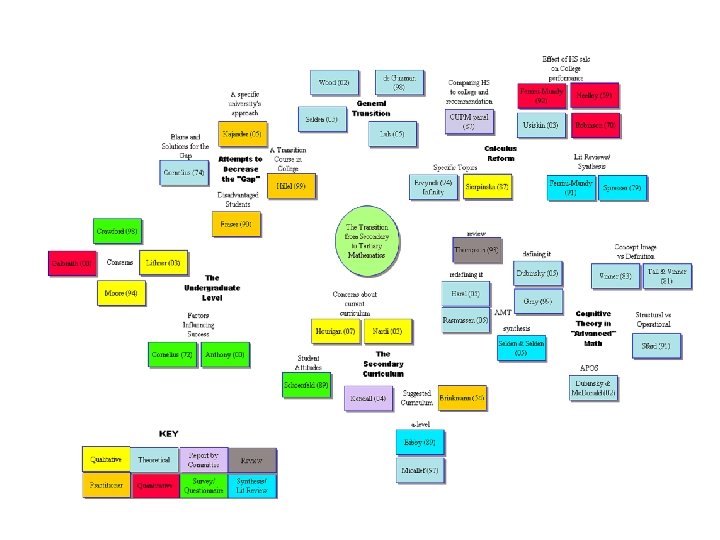
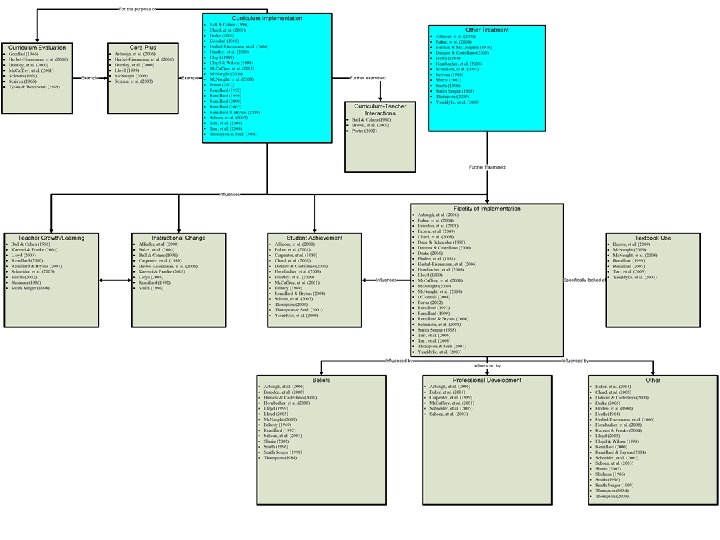
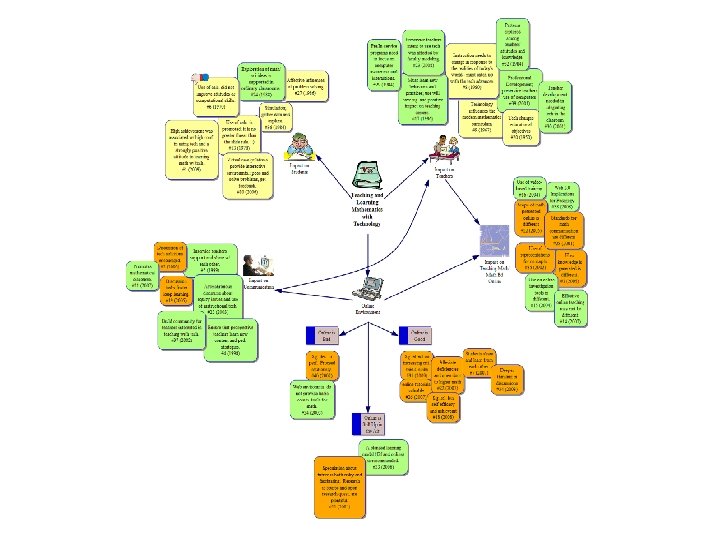
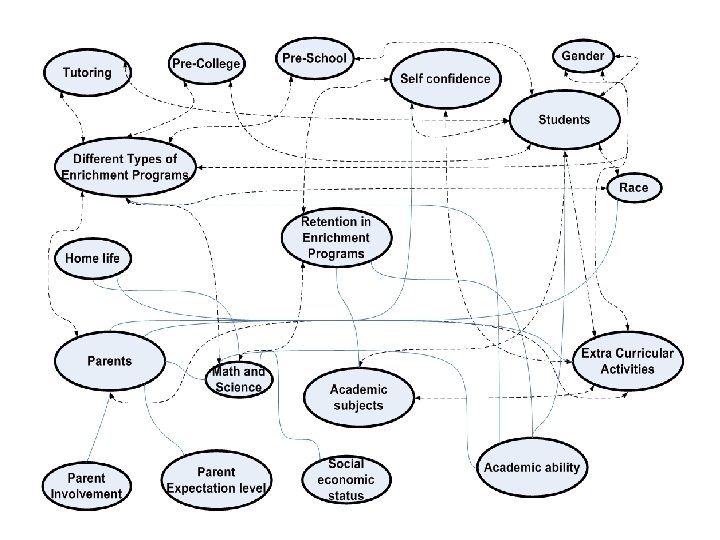
Creating a Map of Literature • NOT creating a mapping of the relationship among certain statistical concepts. INSTEAD…. . • Extracting salient findings or “big ideas” from individual articles • Thinking about how those big ideas or findings are related • Documenting how certain articles contribute to the big ideas
Green- main topics Pink- Empirically based studies (qualitative, teaching experiments, interviews, etc) Blue- Quantitative studies Yellow- Theoretical studies/Literature reviews
• Numbers represent a label for individual articles
Easy-to-Use Mapping Tools • Free – Cmap http: //cmap. ihmc. us/conceptmap. html – Xmind http: //www. xmind. net/ – Vue http: //vue. tufts. edu/index. cfm • Cheap – Inspiration—used in K-12 education. Free 30 day trial http: //www. inspiration. com/Freetrial • Collaborative Mapping – Draw tools in Google Docs—allow for multiple simultaneous editors – Browser-based Mind 42 http: //www. mind 42. com – Webspiration Beta http: //www. mywebspiration. com