Using Cog AT results for Differentiation May 6


- Slides: 39
Using Cog. AT® results for Differentiation May 6, 2014 Dr. Lynn Warren Karen Foushee-Cameron
Cognitive Abilities • Develop from birth through early adulthood. • Are closely related to an individual’s success in school.
Cog. AT ® Cognitive Abilities Test • Measures cognitive development of students in grades K-12. • Measures both general and specific reasoning abilities. • Predicts future levels of achievement. • Scores are valid for 24 months.
Reasoning Abilities Reflect the overall efficiency of cognitive processes and strategies that enable students to learn new tasks and solve problems, especially in the absence of direct instruction.
Primary Uses of Cog. AT Scores ® • To adapt instruction to the needs and abilities of students. (Differentiation) • To provide an alternative measure of cognitive development. • To identify students whose predicted levels of achievement are vastly different from their observed academic achievement.
Cognitive Domains • Verbal • Quantitative • Nonverbal
Verbal Reasoning • Verbal classification, sentence completion, and verbal analogies. • Critically important for success in school. • Learn by talking or writing about new information.
VERBAL BATTERY § § Verbal Battery measures: Verbal inductive and deductive reasoning Flexibility, fluency and adaptability in working with verbal materials and problems Students must have a variety of verbal strategies to be successful. Skills measured affect reading comprehension, critical thinking , writing and all verbal learning tasks.
Quantitative Reasoning • Number sense. • Excel in rule-based math. • Tied to higher knowledge of grammar and spelling. • Acquire computer skills quickly.
QUANTITATIVE BATTERY § § Quantitative Battery measures: Deductive and inductive reasoning skills in working with quantitative symbols and concepts Flexibility and fluency in working with quantitative symbols and concepts Order, structure and give meaning to a set of numerals To be successful, students must have a variety of strategies for working with quantitative materials
Nonverbal Reasoning • Symbolic, visual and spatial stimuli. • Adept at solving novel problems. • Prefer visual mental models, charts, illustrations, etc. • Essential for high-level learning and creative contributions. • 2 nd language learners usually score much higher in this domain.
NONVERBAL BATTERY § § Nonverbal Battery measures: Use only geometric shapes and figures that have little direct relationship to formal schooling No reading and no outside fund of knowledge required Requires reasoning, but not spatial reasoning (gender biased) To be successful students must have well-developed strategies and flexibility as they work with novel materials
TEST STRUCTURE Verbal Battery Test 1: Verbal Classification Test 2: Sentence Completion Test 3: Verbal Analogies Quantitative Battery Test 4: Quantitative Relations Test 5: Number Series Test 6: Equation Building Non-verbal Battery Test 7: Figure Classification Test 8: Figure Analogies Test 9: Figure Analysis 65 items 20 items 25 items 60 items 25 items 20 items 15 items 65 items 25 items 15 items Total items 190
Cog. AT Label ® Student Name ID Number 0000000 Cognitive Abilities Test Date 03/07 Form Profile 6 9 E(V-) No. Raw Att. Score Age Scores USS SAS PR S Verbal 44 44 32 155 102 55 5 64 6 Quantitative 44 44 42 197 128 96 9 98 9 Nonverbal 44 44 43 210 131 97 9 99 9 187 123 92 8 97 9 Test Composite No. of Items Date of Birth Age Grade Level 12/99 06 -11 1 1 Grade • Norm based standardized test • 50% is average compared to other students of the same age. • Scores are valid for 24 months.
HOW TO READ THE COGAT LABEL + extremely variable responses page 62 Responses to items or subtests were inconsistent, may have missed many easy items but correctly answered more difficult ones or scored lower on one of the subtests than on another. # too few items attempted ------------------------------ Age and Grade Score We are using age score? ? See page 70 of the manual Students who are younger or older than their grade peers Look at date of birth
HOW TO READ THE COGAT LABEL A – all scores are at roughly the s. Ame level B- one score is a. Bove or Below the other two – a relative strength or a relative weakness C- Two scores Contrast – a relative strength AND a relative weakness E – there are Extreme score differences- at least two scores differ by 24 or more points on the Standard Age Score SAS scale
Stanine Student Name ID Number 0000000 Cognitive Abilities Test Date 03/07 Form Profile 6 9 E(V-) No. Raw Att. Score Age Scores USS SAS PR S Verbal 44 44 32 155 102 55 5 64 6 Quantitative 44 44 42 197 128 96 9 98 9 Nonverbal 44 44 43 210 131 97 9 99 9 187 123 92 8 97 9 Test No. of Items Date of Birth Age Grade Level 12/99 06 -11 1 1 Composite Stanines 1 -3 level Stanines 4 -6 level Stanines 7 -8 Grade Below Average below grade Average on grade Above Average high ability
Stanines • Another way to describe student’s performance. • Comparable to SAS and percentile ranks. • Offers a broader grouping for comparison. Stanine PR SAS 5 50 100 Average
HOW TO READ THE SAS Very high 128 -150 PR 89 -95 96 -99 8 Above average 112 -127 9 77 -88 7 Average 89 -111 24 -40 41 -59 60 -76 4 Below average 73 -88 5 5 -11 2 Very low 50 -72 12 -23 3 1 -4 1 6
High Cog. AT ↔ Low Grades Should be checked for: • Learning disabilities • Poor vision • Hearing loss • A different instructional program necessary
Low Cog. AT ↔ High Grades • Learns specific skills well. • Has trouble solving unfamiliar problems. Will profit from: • Tasks that emphasize transfer of knowledge. • Tasks that require innovative thinking.
Profile Score Student Name ID Number 0000000 Cognitive Abilities Test Date 03/07 Form Profile 6 9 E(V-) No. Raw Att. Score Age Scores USS SAS PR S Verbal 44 44 32 155 102 55 5 64 6 Quantitative 44 44 42 197 128 96 9 98 9 Nonverbal 44 44 43 210 131 97 9 99 9 187 123 92 8 97 9 Test Composite No. of Items Date of Birth Age Grade Level 12/99 06 -11 1 1 9 E(V-) Grade
How to read the Cog. AT label • A – all scores are at roughly the s. Ame level • B- one score is a. Bove or Below the other two – a relative strength or a relative weakness • C- Two scores Contrast – a relative strength AND a relative weakness • E – there are Extreme score differences- at least two scores differ by 24 or more points on the Standard Age Score SAS
Profile Score • Compiled from the scores on all 3 domains. • Identifies scores that are significantly higher or lower than the other scores. Known as the pattern of scores • Indexes the overall level of the 3 scores.
Profile Score Student Name ID Number 0000000 Cognitive Abilities Test Date 03/07 Form Profile 6 9 E(V-) No. Raw Att. Score Age Scores USS SAS PR S Verbal 44 44 32 155 102 55 5 64 6 Quantitative 44 44 42 197 128 96 9 98 9 Nonverbal 44 44 43 210 131 97 9 99 9 187 123 92 8 97 9 Test Composite No. of Items Date of Birth Age Grade Level 12/99 06 -11 1 1 Grade Go to Riverside Publishing website for interpretation of the Profile Score. You will also get instructional suggestions for that student www. riverpub. com/products/group/cogat 6/input. jsp
INTERACTIVE PROFILE INTERPRETATION SYSTEM www. cogat. com Gives suggestions for instructing each student based on their Cog. AT score profile “A Short Guide for Teachers” is also available free and gives information on instructional practice. A copy has been provided for each teacher in your testing materials.
• • • Understanding the Cog. AT Profile Go to www. cogat. com Locate ---Providing a More Complete Picture of Student Abilities Select Learn More Look at the menu at the top of the page and select Ability Profile System. Look at the right side of the page and find Input Your Score Profile.
• Enter the Profile score found on the Cog. AT label on the yellow sheet in the Cum. folder. Ex: 7 C(V+Q-) Click on Select. • Read and/or print the profile for the student. • Information includes: • Profile Explanation • Characteristics of Student with These Profiles • Instructional Suggestions • Build on Strengths • Focus on Working Memory • Scaffold Wisely • Encourage Strategies Thinking • When grouping, aim for diversity • For additional information
IRM Interactive Results Manager • Each teacher receives a user name and password • http: //irm 30. rpclearing. com • Many different ways are available to review class and individual results. • Principal has access to the school results. • Along with the student profile score, results provide excellent suggestions for instruction.
Cog. AT Cognitive Abilities Test Raw Data Cog. AT • Verbal 70 % • Quantitative 55% • Nonverbal 70% • What does this data tell us about this student’s aptitude?
Cog. AT Cognitive Abilities Test Cog. AT • Verbal 70 % Grades • Language Arts 97 for the first 3 quarters • Quantitative 55% • Nonverbal 70% • Now what do we know? • Math 99 for the first three quarters.
What other data is needed? Renzulli Checklist EOG • Now what do we know? • ELA – 99 % • Should the classroom teacher complete a Renzulli Checklist? • Math – 91 %
Cog. AT Cognitive Abilities Test Cog. AT • Verbal 70 % Grades • Language Arts 97 for the first 3 quarters • Quantitative 55% • Nonverbal 70% • What information do these results show? • Math 99 for the first three quarters.
Cog. AT Cognitive Abilities Test Raw Data Cog. AT • Verbal 70 % • Quantitative 55% • Nonverbal 70% • Now what do we know? • 65 question • Answered 61 • Number correct 54 • 60 questions • Answered 41 • Number correct 41 • 65 questions • Answered 54 • Number correct 53
MAIN USES OF COGAT Guide efforts to adapt instruction to student needs Provide alternative measures to cognitive development Identify students whose predicted levels of achievement are very different from observed levels of achievement
RECOMMENDATIONS FOR FREQUENCY OF TESTING Cog. AT scores should be viewed as a description of the student’s cognitive ability at the time the test was taken. Little change in cognitive ability occurs in one year, but real changes can be observed over a 2 to 3 year period. Description of student’s cognitive ability should be updated every 2 to 3 years. This explains why we test in grades 3 and 5.
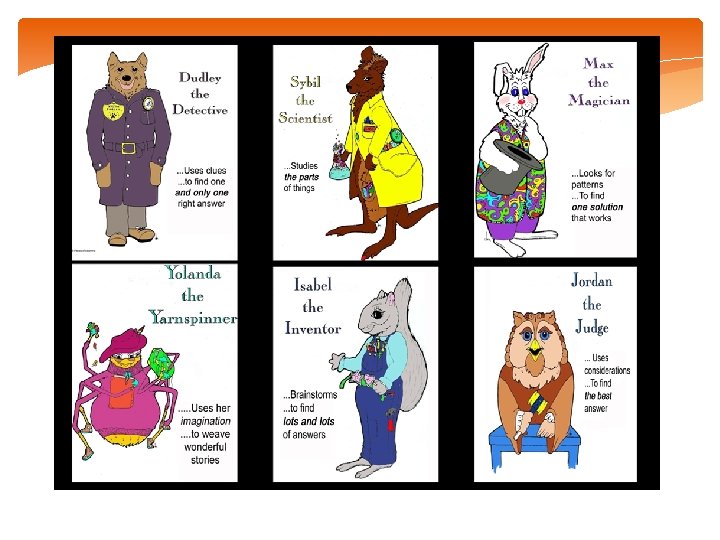
PREPARING STUDENTS IN GRADES K-3 The Primary Education Thinking Skills program introduces students to different ways of thinking. Each character models one of the following: Divergent thinking Convergent thinking Visual/Spatial thinking Evaluative thinking Activities provide students with opportunities to learn how to think in different ways and then the teachers uses the thinking skills with content lessons.
COGAT PROFILE Information includes: Profile Explanation Characteristics of Student with These Profiles Instructional Suggestions Build on Strengths Focus on Working Memory Scaffold Wisely Encourage Strategies Thinking When grouping, aim for diversity For additional information