Using Big Data to Solve Economic and Social

Using Big Data to Solve Economic and Social Problems Professor Raj Chetty Head Section Leader: Gregory Bruich, Ph. D. Spring 2019

Part 1 Local Area Variation in Upward Mobility Causal Effects of Neighborhoods

Causal Effects of Neighborhoods vs. Sorting § Two very different explanations for variation in children’s outcomes across areas: 1. Sorting: different people live in different places 2. Causal effects: places have a causal effect on upward mobility for a given person

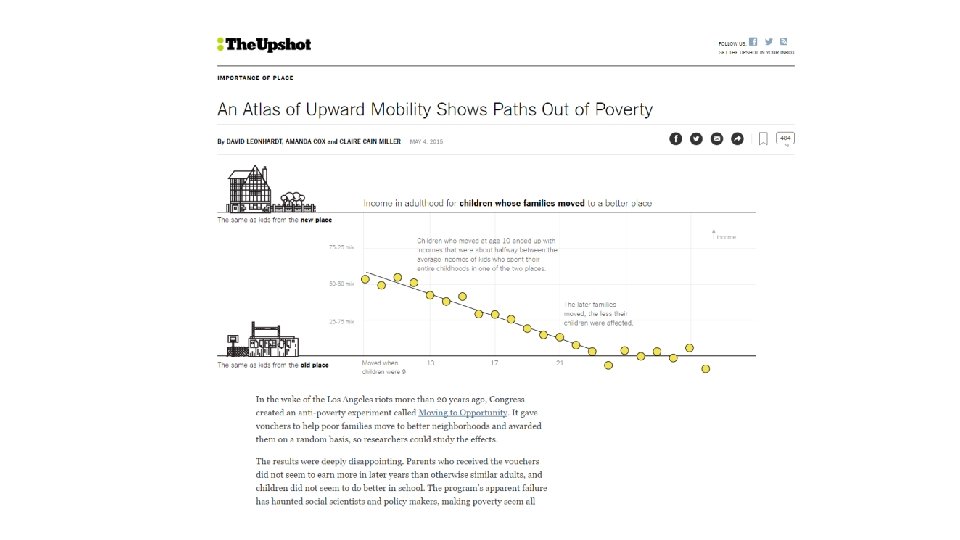
Identifying Causal Effects of Neighborhoods § Ideal experiment: randomly assign children to neighborhoods and compare outcomes in adulthood § We approximate this experiment using a quasi-experimental design – Study 3 million families who move across Census tracts in observational data – Key idea: exploit variation in age of child when family moves to identify causal effects of environment Source: Chetty and Hendren QJE 2018; Chetty, Friedman, Hendren, Jones, Porter 2018

Income Gain from Moving to a Better Neighborhood By Child’s Age at Move Average Income at Age 35 $41 K Savin Hill $35 K $29 K Roxbury $23 K 2 10 20 Age of Child when Parents Move 28

Income Gain from Moving to a Better Neighborhood By Child’s Age at Move Average Income at Age 35 $41 K Savin Hill Move at age 2 from Roxbury to Savin Hill average earnings of $38, 000 $35 K $29 K Roxbury $23 K 2 10 20 Age of Child when Parents Move 28

Income Gain from Moving to a Better Neighborhood By Child’s Age at Move Average Income at Age 35 $41 K Savin Hill $35 K $29 K Roxbury $23 K 2 10 20 Age of Child when Parents Move 28

Income Gain from Moving to a Better Neighborhood By Child’s Age at Move Average Income at Age 35 $41 K Savin Hill $35 K $29 K Roxbury $23 K 2 10 20 Age of Child when Parents Move 28

Identifying Causal Effects of Neighborhoods § Key assumption: timing of moves to a better/worse area unrelated to other determinants of child’s outcomes § This assumption might not hold for two reasons: 1. Parents who move to good areas when their children are young might be different from those who move later 2. Moving may be related to other factors (e. g. , change in parents’ job) that affect children directly

Identifying Causal Effects of Neighborhoods § Two approaches to evaluating validity of this assumption: 1. Compare siblings’ outcomes to control for family effects

Identifying Causal Effects of Neighborhoods § Two approaches to evaluating validity of this assumption: 1. Compare siblings’ outcomes to control for family effects 2. Use differences in neighborhood effects across subgroups to implement “placebo” tests – Ex: some places (e. g. , low-crime areas) have better outcomes for boys than girls – Move to a place where boys have high earnings son improves in proportion to exposure but daughter does not § Conclude that about two-thirds of the variation in upward mobility across areas is due to causal effects

Part 1 Local Area Variation in Upward Mobility Characteristics of High-Mobility Areas

Why Does Upward Mobility Differ Across Areas? § Why do some places produce much better outcomes for disadvantaged children than others? § Begin by characterizing the properties of areas with high rates of upward mobility using correlational analysis § Do places with higher mobility tend to have better jobs, schools, different institutions, …?

Average Income at Age 35 of Children who Grew up in Low-Income Families Upward Mobility vs. Job Growth in the 30 Largest Metro Areas $38 K San Jose High mobility, low growth San Francisco Minneapolis Boston Pittsburgh $34 K $30 K Seattle New York Los Angeles San Diego Philadelphia Cleveland Sacramento Washington Portland. Houston Denver Riverside Miami Kansas City Chicago Cincinnati Detroit $26 K High mobility, high growth St. Louis Baltimore Dallas Tampa Charlotte Low mobility, low growth 0 20 San Antonio Phoenix 40 Job Growth Rate (%) from 1990 -2010 Atlanta Low mobility, high growth 60

Five Strongest Correlates of Upward Mobility 1. Segregation – Greater racial and income segregation associated with lower levels of mobility
, Blacks (green), Asians (red), Hispanics (orange) Source: Cable")
Racial Segregation in Atlanta Whites (blue), Blacks (green), Asians (red), Hispanics (orange) Source: Cable (2013) based on Census 2010 data
, Blacks (green), Asians (red), Hispanics (orange) Source: Cable")
Racial Segregation in Sacramento Whites (blue), Blacks (green), Asians (red), Hispanics (orange) Source: Cable (2013) based on Census 2010 data

Five Strongest Correlates of Upward Mobility 1. Segregation 2. Income Inequality – Places with smaller middle class have much less mobility

Five Strongest Correlates of Upward Mobility 1. Segregation 2. Income Inequality 3. School Quality – Higher expenditure, smaller classes, higher test scores correlated with more mobility

Five Strongest Correlates of Upward Mobility 1. Segregation 2. Income Inequality 3. School Quality 4. Family Structure – Areas with more single parents have much lower mobility – Strong correlation even for kids whose own parents are married

Five Strongest Correlates of Upward Mobility 1. Segregation 2. Income Inequality 3. School Quality 4. Family Structure 5. Social Capital – “It takes a village to raise a child” – Putnam (1995): “Bowling Alone”

Part 1 Local Area Variation in Upward Mobility Policies to Improve Upward Mobility

Policy Interest in Increasing Upward Mobility § Recent research has shifted national conversation on poverty to focus on income mobility and the role of childhood environment

Why are we here?

January 25, 2014

The Geography of Opportunity in Charlotte < $16 k $34 k > $56 k
- Slides: 28