
Using Big Data for Behavioural analysis Shiri Antaki
Using Big Data for Behavioural analysis Shiri Antaki & Iliya Kaufman
The need for machine learning • Big Data and Machine learning withhold great potential, which can be leveraged in every field to create new unthinkable solutions for problems which seemed impregnable before. • Our project, led by Professor Shlomi Dolev and Dr. Alexander Binun, strives to use this technology for behavioural analysis. • The goal of the project is to identify mood changes, which could be used to detect Postpartum depression (PPD), most common in women after childbirth.
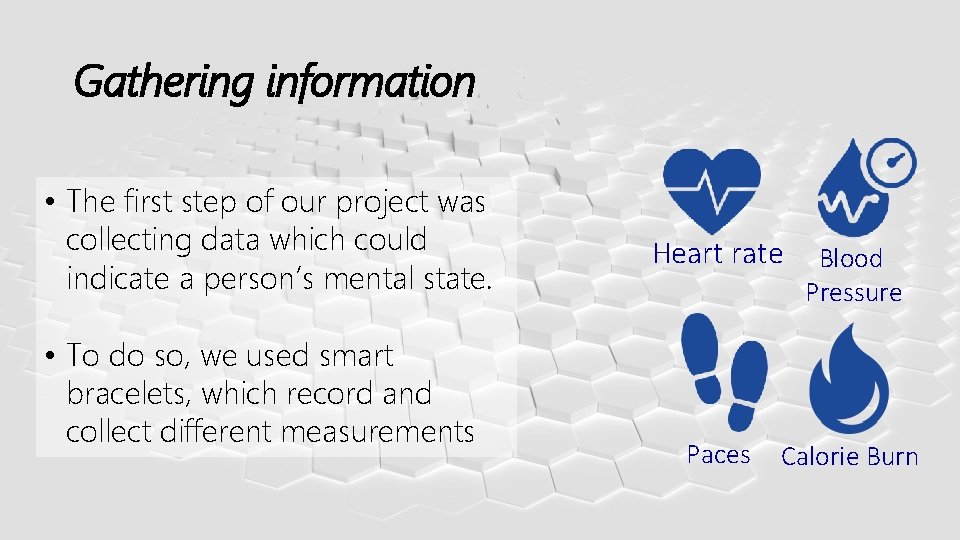
Gathering information • The first step of our project was collecting data which could indicate a person’s mental state. • To do so, we used smart bracelets, which record and collect different measurements Heart rate Paces Blood Pressure Calorie Burn
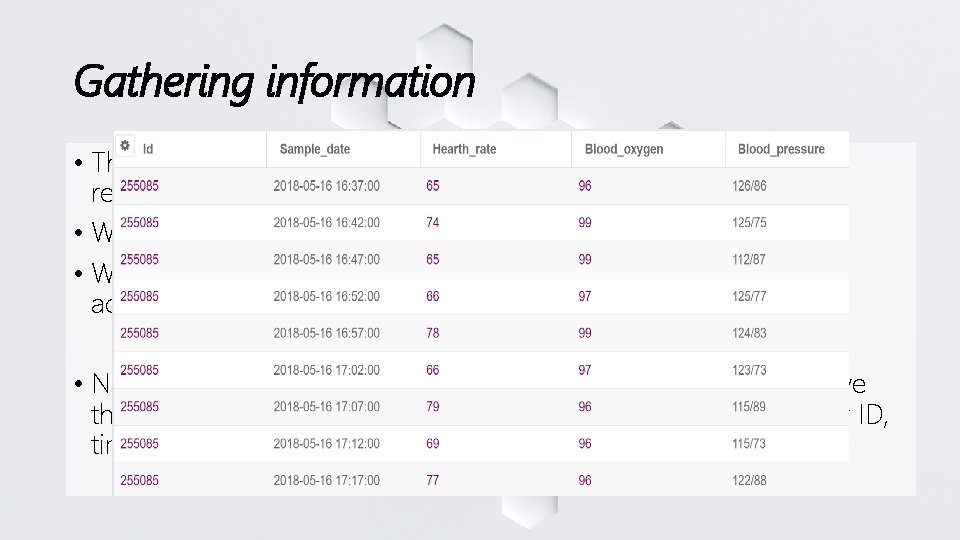
Gathering information • The bracelets sent the collected data to an app, which sent it to a remote server. • We traced packets sent to the server and located its IP address. • We then analyzed the requests sent by the app to imitated it to acquire the data ourselves. • Next, we wrote a script in Java which contacts the server to receive the data and parses it, creating a database organized by the user ID, time of measurement, and type of measurement.
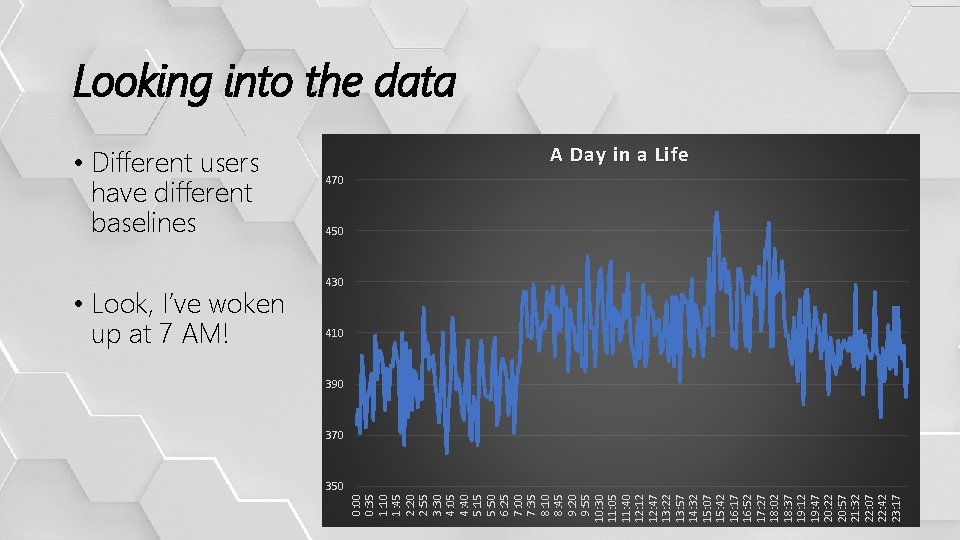
Looking into the data • Different users have different baselines AWeekly Day in adata Life 470 410 450 400 390 Cumulative score 410 380 370 390 360 370 350 340 15 -May 16 -May 17 -May 18 -May 19 -May 20 -May 21 -May 22 -May 0: 00 0: 35 1: 10 1: 45 2: 20 2: 55 3: 30 4: 05 4: 40 5: 15 5: 50 6: 25 7: 00 7: 35 8: 10 8: 45 9: 20 9: 55 10: 30 11: 05 11: 40 12: 12 12: 47 13: 22 13: 57 14: 32 15: 07 15: 42 16: 17 16: 52 17: 27 18: 02 18: 37 19: 12 19: 47 20: 22 20: 57 21: 32 22: 07 22: 42 23: 17 • Look, I’ve woken up at 7 AM! 430 241984 255085 255839 256153 256231
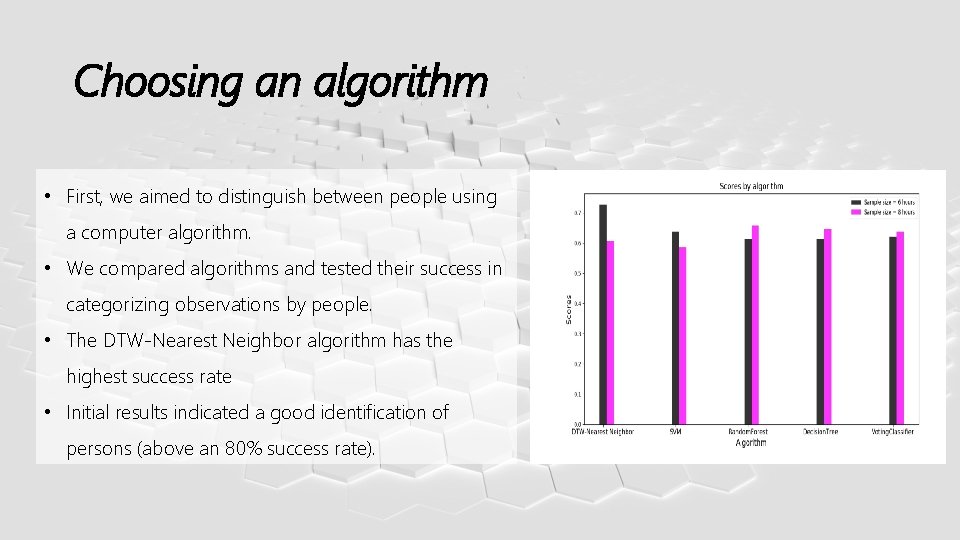
Choosing an algorithm • First, we aimed to distinguish between people using a computer algorithm. • We compared algorithms and tested their success in categorizing observations by people. • The DTW-Nearest Neighbor algorithm has the highest success rate • Initial results indicated a good identification of persons (above an 80% success rate).

Identifying mood changes • The next stage is finding an algorithm that can manage to identify drastic changes in the physical parameters collected by the bracelets, associated with mood changes. • we used a “natural experiments” - using our own exam period as a reference point in which we were likely to have higher stress levels, which could possibly be reflected in our physical data as well. • Having limited data from our recent exams period, we used sample data to test different algorithms and see which would do best for this cause.
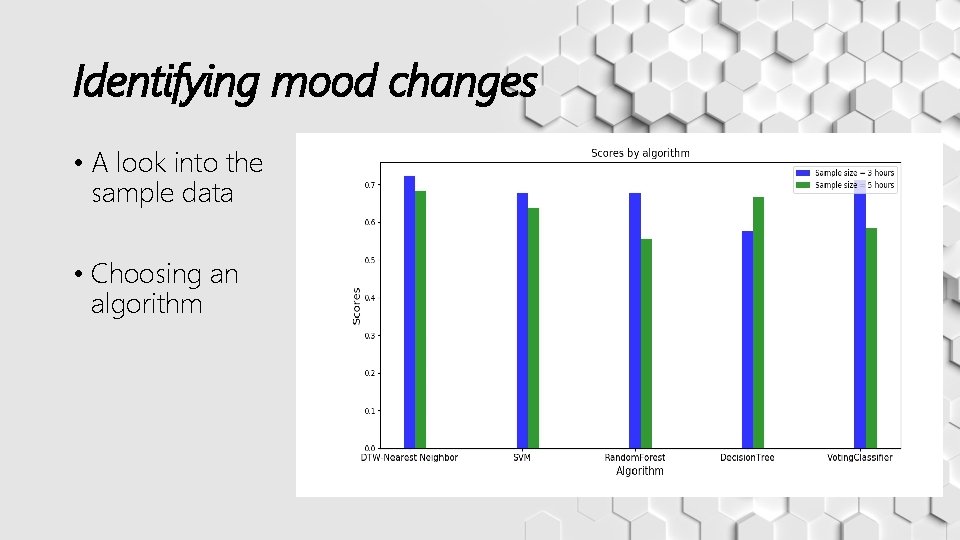
Identifying mood changes • A look into the sample data Rise in physical cumulative score in exams period 395 0. 9 390 0. 8 385 0. 7 380 375 0. 5 370 0. 4 365 0. 3 360 0. 2 355 25 /2 0 18 18 1/ /2 0 24 18 1/ /2 0 23 18 1/ /2 0 22 1/ 21 /2 0 18 18 Beginning of exams period 1/ /2 0 20 18 1/ /2 0 19 18 1/ /2 0 18 1/ 17 /2 0 18 18 Cumulative score 1/ /2 0 16 18 1/ /2 0 15 1/ 14 /2 0 18 18 1/ /2 0 13 18 1/ /2 0 12 1/ /2 0 11 1/ /2 0 10 1/ 20 1/ 9/ 20 18 345 18 0. 1 18 350 1/ 8/ • Choosing an algorithm 0. 6
Identifying mood changes – the next steps • We will base our work on the Hidden Markov Model (HMM), which assumes there are several states the data can represent. • The model defines those states itself, and then provides the probability of switching from one state to another. • Once at the new state, the model provides probabilities of moving to other states regardless of the state of origin. • We hypothesize that the Hidden Markov Model will be able to classify different moods as “states”, and allow us to connect between data structures and the actual feelings they represent.
Identifying mood changes – the next steps • Since there are some indications that changes in a person’s sleeping patterns are a good indicator to mood changes, we plan on recording our own sleeping patterns in the upcoming exams period. • Using this information, we will be able to use computer algorithms to detect the expected changes, and create a Proof-Of-Concept.
- Slides: 10