Using Aerosol Express aka Giovanni4 with MODIS Aerosol
 with MODIS Aerosol Data James G. Acker NASA Goddard")


 Smoothed plotting option Unsmoothed (default)")


- Slides: 22
Using Aerosol Express (aka Giovanni-4) with MODIS Aerosol Data James G. Acker NASA Goddard Earth Sciences Data and Information Services Center (GES DISC) October 1, 2014
Aerosol Express & Giovanni-4 The first public release of the next-generation Giovanni system, Giovanni-4, was named Aerosol Express because it operated exclusively atmospheric aerosol data. This presentation will demonstrate the basic operations of Giovanni-4, and provide two basic case studies using the system.
The basic operations of Giovanni-4, like its predecessor system, are: Ø Selecting the desired visualization type; Ø selecting the time period of interest; Ø selecting the spatial area of interest; and Ø selecting the data variables to be plotted. The following slides will demonstrate each of these operations.
The Giovanni-4 Interface
Selecting a Visualization Type
Selecting a Data Product
Selecting a Time Period
Selecting a Spatial Region
Result Im ions patd o l O t n o l w P o ) age d d range an (palette Re p ma ort ke a p Do a s rob it a ug le ga ge m in sti or on
Image Download (PNG; Geo. TIFF also available) Smoothed plotting option Unsmoothed (default)
Share-able URLs ! The URL for this session: http: //giovanni. gsfc. nasa. gov/giovanni/#service=INTERACTIVE_MAP &starttime=2004 -03 -01 T 00: 00 Z&endtime=2004 -0630 T 23: 59 Z&bbox=44. 2969, 2. 3203, 12. 6563, 45. 2109&data=MYD 08_M 3_051_Optical_D epth_Land_And_Ocean_Mean&variable. Facets=data. Field. Disci pline%3 AAerosols%3 B
Time-Series Case Studies I. A “Normal” Time – Series
Result
Time-Series Case Studies II. A Seasonal Time – Series
Result
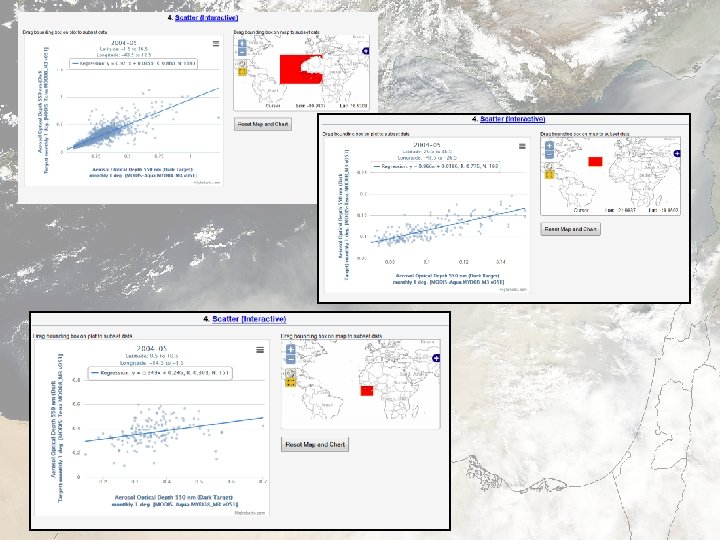
Interactive Scatter Plot : Compare MODIS-Terra AOD to MODIS-Aqua AOD MODIS-Terra AOD May 2004 MODIS-Aqua AOD May 2004
Interactive Scatter Plot : Compare MODIS-Terra AOD to MODIS-Aqua AOD Choose 2 variables to compare
Interactive Scatter Plot : Compare MODIS-Terra AOD to MODIS-Aqua AOD
Interactive Scatter Plot : Compare MODIS-Terra AOD to MODIS-Aqua AOD
Interactive Scatter Plot : Compare MODIS-Terra AOD to MODIS-Aqua AOD
Thank you for attending this demonstration of Giovanni-4 today. Any questions?