Using a SocioEcological Model to Develop Strategies for


 Social Attitudes/policies Classism/racism Family policies Social welfare policies")


- Slides: 57
Using a Socio-Ecological Model to Develop Strategies for Impacting MCAH Outcomes Geraldine Oliva M. D. , MPH Jennifer Rienks, Ph. D FHOP Webinar March 29 th, 2010
Today’s Agenda n Review emerging paradigms in Public Health n Overview of traditional public health planning process n Using a socio-ecological problem analysis framework to identify causal pathways n Developing strategies to address a problem based on addressing upstream causes and risks n Identifying evidence based interventions to implement the strategies
New Paradigms for Understanding Persistent Disparities n n n Emerging evidence that traditional clinical and public health efforts targeting individuals have not impacted health disparities Multi-level analysis has demonstrated the significance of social determinants of health in explaining many of these disparities Re-emergence of the life course model that emphasizes importance of prevention and intervention along the age spectrum
Socio-Ecological Models
Socio-Ecological Models - New BARHII Societal Community Large-scale social structure Experienced Social Environment Economy Government Other Institutions Policy/environme ntal change Family/househ old Neighborhood Work/schools Social network Social-cultural practices Reduce Community stressors Individual Energy/ working capacity Resiliency Identity Social interactions Individual stress reduction Knowledge Genetics Actions Disease and Injury Behaviors Health Access to health knowledge care Social-ecological framework Medical model
Socio-Ecological Models County Housing Workplace Family City ty Individual School ni u m m Co Daycare State Availability of health services Country
Lifecourse Model
Lifecourse Model as a Cycle Mother overweight/ diabetic Poverty/fast food/food habits in young woman Adolescent with increased # fat cells/ abnormal GT School with no PE, unsafe parks latch key child watches TV / gets more overweight Infant born LGA/Abnormal GT Working Mom - Infant Fed Formula Family Culture - high fat, high sugar diet- child overweight
How do we Incorporate these New Paradigms into a Community/Public Health Planning Framework ?
Program Planning Cycle Convene Public Health/ Community Coalition Evaluate/ Measure Performance Plan & Implement Programs Develop Objectives Assess & Prioritize Health Status/Problems Assess Community /MCAH Resources & Strengths/Capacity Analyze Problem & Select Interventions
Rationale for Doing a Formal Problem Analysis? n n n To identify effective intervention strategies, it is necessary to understand the complex array of underlying factors that can impact health outcomes and how factors relate to one another Using a multilevel socio-ecological framework ensures that upstream factors are included Relating upstream precursors to downstream outcomes forces us to explore the pathways by which upstream factors operate in a specific situation
Steps in a Problem Analysis 1. Examine epidemiologic data 2. Examine literature and consult experts 3. Determine extent to which these factors are active in the community
Steps in a Problem Analysis 4. Determine relative contribution of each identified factor 5. Identify the interrelationships among factors – causal pathways 6. Determine the most effective points in the causal pathways for intervention
1. Review Epidemiology of the Problem n n n How does the rate compare to a standard? (i. e. Healthy People 2010) Is the problem increasing or decreasing? Is a particular group more affected than other groups and why? When does the disease / problem occur? What causes the problem?
2. Review Literature and Consult Experts To identify causal or risk factors: - Search the Web - Conduct a literature search or locate one done by reliable source - Invite experts to participate
3. Determine Whether Identified Factors are Relevant - Consult with state or local epidemiologists - Identify studies or results of surveys of the target community - Consult other local agencies or institutions
Convene Your Planning Group n n n Staff need to review information and determine composition of planning group to assure representation at the societal/government/policy level as well as the community and individual levels The group needs to be briefed on the results of the needs assessment and the additional data from steps 1 -3. The group then is asked to brainstorm potential causes and risk factor for the identified health problem or issues
Definitions : Precursors Factors that have been proven to be associated with the problem - Causal factor - Risk factor - Systems barriers - Protective factors
Individual Level Precursors Definition: Factors that operate on the level of the individual (or for a child it could be the parent) that directly cause the outcome in question (cause/effect should be supported by peer reviewed studies) OR Factors that increase the risk of an individual’s likelihood of having the outcome of concern (documented risk)
Examples of Individual Level Precursors: Low Immunization Rate - Child who is immunocompromised - Parental refusal of vaccination due to fear of side effects from vaccine
Family/Household and Local Community Precursors Definition: Factors that operate at the level of the family or local community or institution(s) that increase an individual’s risk of developing a direct precursor May include characteristics of local institutions such availability of healthcare provider‘s that are often, but not always, associated with the problem or its determinants
Examples of Family/Community Level Precursors: Low Immunization Rate - Lack of provider tracking systems/ reminder calls - Transient housing - Missed opportunities at medical visit where child has recurrent or chronic heath problems
Social/Economic/Policy Level Precursors Definition: Factors that are operational at the state or national level such as cultural, health, social, legal or economic factors or policies
Examples of Social/Economic/Policy Level : Low Immunization Rate § Poverty § National vaccine shortage § Lack of available health insurance for poor kids
Consequences Definition: The effects of the problem on individuals, families and society. Can include financial, physical and psychological effects on the individual, the family or the community
Examples of Consequences: Low Immunization Rate - Parent misses work - Loss of herd immunity leading to costly increase in infections - Death or disability for children infected
A Generic Framework for Health Problem Analysis Social/Economic/Policy Level SES Culture Safety Environment Education Economy Health Care Policies Family/Community/Institutional Level School/Workplace Family/Household Community Health Care/Providers Individual Level Genetic/Biological Psychological Factors Cognitive Factors Health Status/ Medical Conditions Health Behaviors Identified Problem
Upstream Factors (Social/ Economic/ Policy Level) Social Attitudes/policies Classism/racism Family policies Social welfare policies Healthcare Costs Insurance policies HC distribution Coverage for Mental Health/Substance Abuse Health regulations Environment Toxic exposures Air quality Physical hazards Zoning/land use Infrastructure policy Education Funding Class size Standards College access Adult Ed policies Economy Income inequity Lack of jobs Tax policy Regulations Occupational Health and Safety Corporate practices Safety Police funding Highway safety regulations Driving laws Criminal laws Gun policies
Family/Community Factors Family/Household Family structure Educational level Income Genetics Parenting style Family connectedness Behavioral Factors Family Violence School Physical /toxic hazards Relationships Quality of teaching Educational resources Safety Community Extended family Close friends Religious affiliation Social networks Social cohesion Blight Transportation Sources of support Workplace Physical/toxic hazards Pay Job security Opportunities for advancement Psychological atmosphere Health insurance Healthcare/Provider Number of providers Quality of care Location of services Willingness to take insurance Costs
Individual level Inborn Conditions Genetic Metabolic Biological Psychological Anxiety Depression Resiliency Self esteem Self efficacy Stress Allostatic load Health Behaviors Cognitive Level of education Learning challenges Smoking Tobacco use Illegal substance use Eating disorders Sedentary lifestyle
SES/Policy Marketing by fast food industry Inadequate subsidized health insurance for the poor Poverty Unsafe neighborhood/streets City planning policies that limit green space in some cities and neighborhoods Lack of funding for education Family/community No opportunities for exercise in school or recreation areas Family lack of health Insurance Health services lack of knowledge of nutrition High costs for treatment Families limited income Unavailability of healthy food choices in local stores , schools and restaurants Individual Unhealthy diet Parental knowledge and behavior (time with kids, food prep, own eating and exercise habits) Too much screen time (TV computer) Insufficiency of physical activity PROBLEM: Childhood Obesity
4. Determine the Contribution of Identified Factors Epidemiologists and other data analysts use a variety of statistical tests to determine risks associated with particular individual level characteristics or risk factors
What information do I need to know be able to identify a causal pathway? n Which populations are most at risk? n Which risk or causal factors are most strongly associated with the identified problem? n Which factor(s) contributes most to the size of this problem? n Which point of intervention will have the greatest potential for improving an outcome?
Useful Statistics: Confidence Interval n Could an observed association between a precursor and an outcome be due to chance? Normal Distribution Curve 95%
What does a confidence interval tell you? n How likely an observed association between two factors is just due to chance (vs. a real relationship between the two factors) n Using a 95% Confidence Interval only 5% of the time or 1 out of 20 times will the observed association between two factors be due just to chance n If the value falls beyond the 95% marker on the right, there is a significantly greater risk associated with the factor in question, if beyond the 95% marker on the left, there is a significantly lower risk n One kind of upstream comparison could be rates of asthma in one neighborhood vs. another with different characteristics
How do I get this information? n n n FHOP has templates that calculate this statistic You only need to know how many people there are in a defined group and how many of them have a particular condition Example – how many births are there in each neighborhood and how many of them are preterm
Useful Statistics: Relative Risk n How much more likely is it that a person or community with one risk factor has a bad outcome compared to a person or community without the risk factor? smoker YES 120 NO 120 LBW ÷ NO 10, 000 = . 012 ÷ 20, 000 = . 006
What does this tell us in words? n n Women who smoke during pregnancy are twice as likely as those who don’t smoke to have LBW babies Implementing a smoking cessation intervention could significantly reduce the rate on LBW in this community.
Useful Statistics: Population Attributable Risk n Answers the question: “If my intervention is successful, how much will it impact the overall rate of this condition in my community? ” by quantifying what portion of the incidence of an outcome among people exposed to a risk factor can be attributed to the exposure to the risk factor n Example: If I am successful in lowering the rate of smoking how many fewer LBW babies will there be and what would my overall LBW rate be as a result of this?
Attributable Risk Diagram
What Benefit is Risk Analysis to me? n n Assists in prioritizing which factors to address Assists in making the case for resources, policy changes and directions to take Assists in developing realistic measurable objectives and performance measures Assists in estimating financial impacts
What if I don’t have any resources for data analysis? n n n Use FHOP templates and technical assistance Use literature or local experts to identify results of other studies Consult with MCAH Epi staff
5. Identify the Relationships Among Factors Determine how identified causal and risk factors interact to either increase the chances of a negative outcome or to promote a positive one
Linkages Definition: The association between precursors and problem § § Review the literature Consult experts Consult stakeholders Use results of risk analyses
SES/Policy Marketing by fast food industry Inadequate subsidized health Insurance for the poor Poverty City planning Policies that limit green space in some cities and neighborhoods Family/community Lack of funding for education No opportunities for exercise in school or recreation areas Family lack of health Insurance Health services lack of knowledge of nutrition High costs for treatment Families limited income Unavailability of healthy food choices in local stores , schools and restaurants Individual Unsafe neighborhood/streets Unhealthy diet Parental knowledge and behavior ( time with kids, food prep, own eating and exercise habits) Too much screen time (TV computer) Insufficient physical activity PROBLEM: Childhood Obesity
6. Determine Intervention Points - Determine where you would get the greatest effect - Determine whethere have been well evaluated interventions - Assess the available resources
Diagramming Causal Pathways to Identify Strategic Interventions Unsafe neighborhood streets Intervention Overweight No opportunities for exercise in school or recreation areas Too much screen time (TV computer) Inadequate physical activity
Benefits n n Clearly documents the decision making process for the group and for others Can use simplified problem analysis or causal pathway diagram to communicate rationale for intervention strategy to policy makers and the public
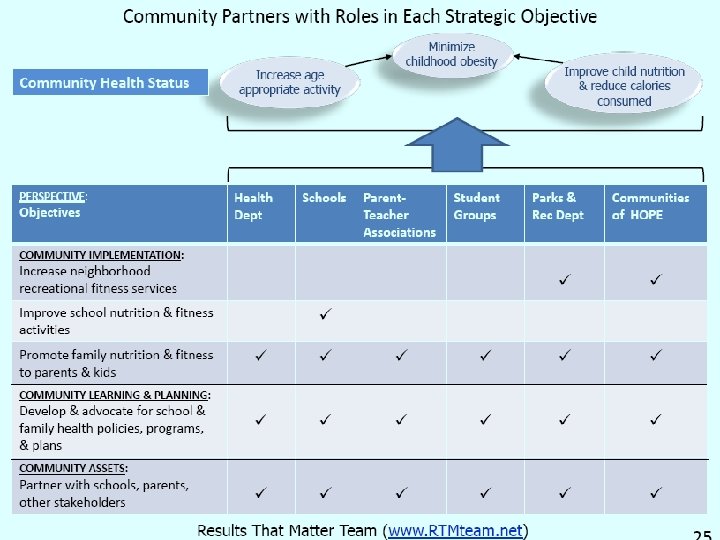
Developing Specific Strategies and Interventions n Use the Mobilizing for Action through Planning and Partnerships (MAPP) and Community Scorecard model n Identify preliminary strategies and engaging appropriate partners n Identify community assets (additional partners and resources) n Implement community wide interventions n Monitor outcomes
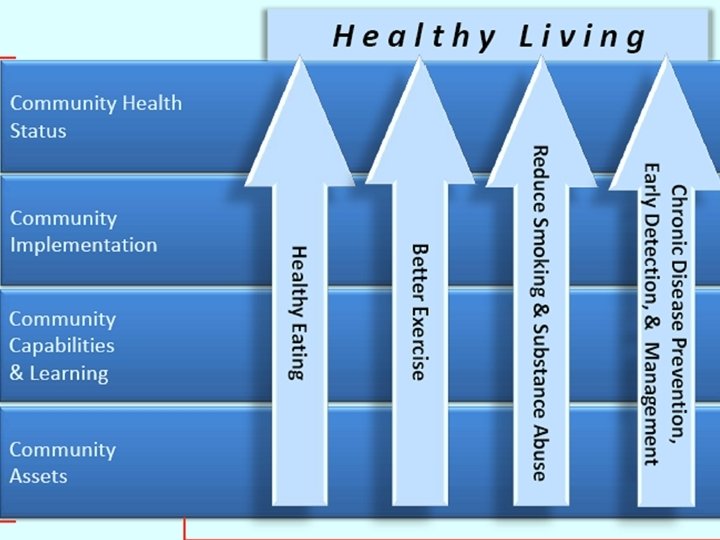
Suggested Perspective for Public Health Community Balanced Scorecards Community Implementation As su m ed ca us e & ef fe ct Community Health Status Community Learning and Planning Community Health Assets Source: Results that Matter (www. RTMteam. net)
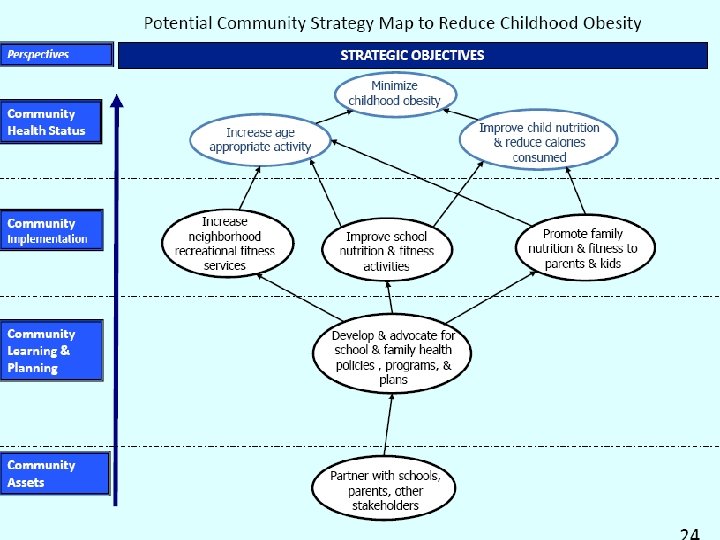
Objectives Brainstorm List: Organize into a Strategy Map n n Develop & advocate for school & family health policies, programs & plans Partner with schools, parents, & other stakeholders Improve school nutrition & fitness activities Improve child nutrition & reduce calories consumed n n Increase neighborhood recreational fitness services Increase age appropriate activity Minimize childhood obesity Promote family nutrition and fitness to parents & kids
Potential Community Strategy Map to Reduce Childhood Obesity Perspectives Community Health Status Community Implementation Community Learning & Planning Community Assets STRATEGIC OBJECTIVES Increase age appropriate activity Increase neighborhood recreational fitness services Minimize Childhood Obesity Improve school nutrition and fitness activities Develop & advocate for school health policies & plans Partner with schools, parents & other stakeholders Improve child nutrition & reduce calories consumed Promote family nutrition & fitness to parents & kids
Take Home Message n Current research is demonstrating very tangible relationships between upstream social determinants and policies and adverse effects on the community and the individuals that live there n It is increasingly clear that only by addressing these factors can long term disparities be reduced n Using a formal socio-ecological framework for problem analysis is a useful way of identifying upstream causal pathways and meaningful intervention strategies n This requires that local MCAH programs build new broad based partnerships that commit to pooling expertise and resources to address upstream issues
Contact Information Gerry Oliva M. D. , MPH Director UCSF Family Health Outcomes Project Telephone 415 -476 -5283 E-mail olivag@fcm. ucsf. edu Web www. ucsf. edu/fhop