USES OF REGRESSION AND CORRELATION ANALYSIS IN BUSINESS


USES OF REGRESSION AND CORRELATION ANALYSIS IN BUSINESS

§ A company will require finding relationships between various business aspects, such as - Relationship between sales achieved and other factors - Number of working days lost due to sickness - How the demand for a product is affected by prices § Methods used to check the relationships • § Regression method: Describe the relationship between variables § Correlation: Provides a measure of how strongly the variables might be related § Multiple regression: Outcome considered is affected by many factors § Time series: Use the relationships identified to make predictions over time § Scatter diagram: illustrate any relationship between two variables.

§ Correlation analysis is used to measure strength of the association / relationship (linear relationship) between two variables by measuring the degree of ‘scatter’ of the data values § No causal effect is implied § The less scatter the data values are, the stronger the correlation. § Two types of correlation § Positive (direct) § Negative (inverse) § It will indicate whether: § Two variables are positively related or negatively related. § Relationship is perfect, strong or weak. § Measures of correlation § Product moment correlation coefficient § Coefficient of determination

§ Product moment correlation coefficient, r It measures the extent to which two variables move in sympathy with or in opposition to one another.

§ The correlation coefficient, r lies between 0 and 1. § When r = 0, it signifies there is no correlation present § When r = 1, it signifies perfect positive correlation § When r = -1, it signifies perfect negative correlation § The further away r is from 0, the stronger is the correlation.

§ Performance Measure: - A correlation is fundamentally a comparison between two or more things. If you compare the performance of two employees, you may find a correlation in that their performance increases when both are working on the same shift. In a simplistic form, a correlation identifies a connection between two elements when they change status. Correlations are scored in a three-number format with -1 as no correlation, 0 for some kind of influence and 1 for a true, strong correlation. § Projection Tool: - The most valuable use of a correlation is in predicting the future of a business direction. If marketers and salespeople can identify a correlation between the behavior of consumers and events and a particular type of product or service, they can take advantage of the relationship to boost business and ultimately profits

§ Direction Change: - Just because a correlation is found does not mean it’s always a good thing for a business. Sometimes correlations work inversely. For instance, if inflation rises and job losses go up in a market, a business can see fewer sales on their product because of lower consumer purchasing. This shrinkage or opposite direction from the first factor is an inverse correlation, which a business would want to anticipate and avoid. § Data Mining and Patterns: - With the widespread use of computers in modern business, significant amounts of data and files exist in many businesses. Companies have found that sorting this information can identify patterns otherwise not visible in folders or isolated in operational silos of business functions. By looking for data relationships and correlations or “data-mining, ” businesses have found they can leverage existing information for better management, customer retention and improved operations.


§ Regression in concerned with obtaining a mathematical equation which describes the relationship between two variables. § The independent variable is the one that is chosen freely or occurs naturally. § The dependent variable occurs as a consequence of the value of the independent variable. § It is normally used for estimation purposes. § Simple Linear Regression § Analysis of single regressor – § One independent variable explains the behavior of dependent variable § Multiple Regression – § Application with more than one regressor – § More than one independent variable explains the behavior of dependent variable
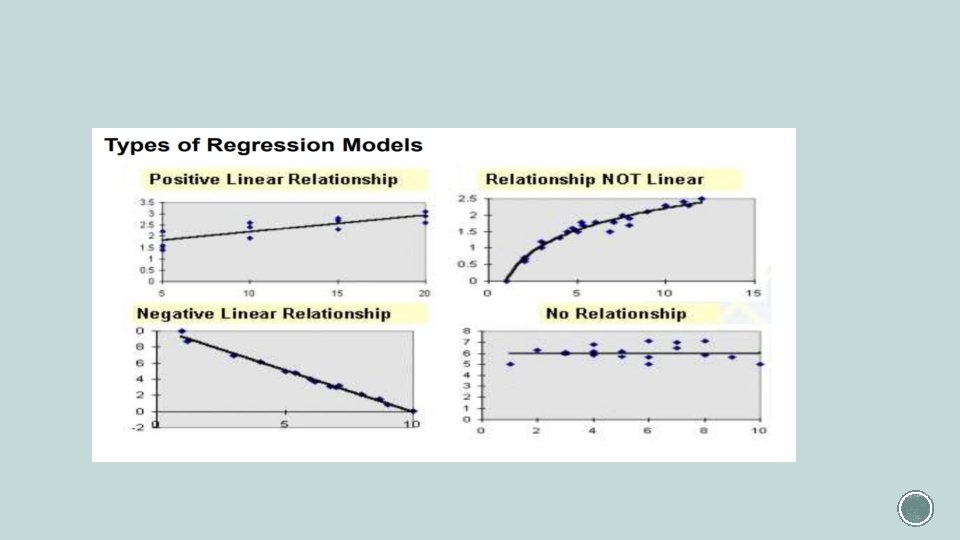

§ Regression Models – § Regression line is the best straight line description of the plotted points and can use it to describe the association between the variables. § If all the dots fall exactly on the line then the line is 0 and you have a perfect relationship. § 3 common methods used to determine a regression line § Inspection method § Semi-average method § Least square method § The standard method of obtaining a regression line. § For any set of bivariate, we estimate y given a value of x (y on x regression line)

§ After developing the regression model the coefficient ‘a’ and ‘b’ can be identified thereafter for a given value of ‘x’ the corresponding value of ‘y’ can be predicted. § A company will require estimates on future happenings in order to draw their business plans. When preparing budgets following estimates are required. - No of units to be sold during the year, The total cost of producing the units, Future selling price of the product, etc. § Assumptions: § It is assumed that only one independent variable will influence toward the dependant variable. § It is assumed that past trends will continue in the future. § The accuracy of the model will depend upon the reliability of the data collected.
 When the variable")
§ Problems involved in using regression equations forecasting purposes are: I) When the variable relationship is strong a regression equation may be reliably used to forecast. But the regression line does not indicate how good the relationship is in terms of how well the line represents the observed data. II) When the extrapolation is included, the forecast may prove inaccurate if the value of x is too far beyond the range of observed values.

§ 1. Predictive Analytics: Predictive analytics i. e. forecasting future opportunities and risks is the most prominent application of regression analysis in business. Demand analysis, for instance, predicts the number of items which a consumer will probably purchase. However, demand is not the only dependent variable when it comes to business. RA can go far beyond forecasting impact on direct revenue. For example, we can forecast the number of shoppers who will pass in front of a particular billboard and use that data to estimate the maximum to bid for an advertisement. Insurance companies heavily rely on regression analysis to estimate the credit standing of policyholders and a possible number of claims in a given time period. Data Science understanding is key for predictive analytics.

§ 2. Operation Efficiency: Regression models can also be used to optimize business processes. A factory manager, for example, can create a statistical model to understand the impact of oven temperature on the shelf life of the cookies baked in those ovens. In a call center, we can analyze the relationship between wait times of callers and number of complaints. Data-driven decision making eliminates guesswork, hypothesis and corporate politics from decision making. This improves the business performance by highlighting the areas that have the maximum impact on the operational efficiency and revenues. § 3. Supporting Decisions: Businesses today are overloaded with data on finances, operations and customer purchases. Increasingly, executives are now leaning on data analytics to make informed business decisions that have statistical significance, thus eliminating the intuition and gut feel. RA can bring a scientific angle to the management of any businesses. By reducing the tremendous amount of raw data into actionable information, regression analysis leads the way to smarter and more accurate decisions. This does not mean that RA is an end to managers creative thinking. This technique acts as a perfect tool to test a hypothesis before diving into execution

§ 4. Correcting Errors: Regression is not only great for lending empirical support to management decisions but also for identifying errors in judgment. For example, a retail store manager may believe that extending shopping hours will greatly increase sales. RA, however, may indicate that the increase in revenue might not be sufficient to support the rise in operating expenses due to longer working hours (such as additional employee labor charges). Hence, this analysis can provide quantitative support for decisions and prevent mistakes due to manager’s intuitions § 5. New Insights: Over time businesses have gathered a large volume of unorganized data that has the potential to yield valuable insights. However, this data is useless without proper analysis. RA techniques can find a relationship between different variables by uncovering patterns that were previously unnoticed. For example, analysis of data from point of sales systems and purchase accounts may highlight market patterns like increase in demand on certain days of the week or at certain times of the year. You can maintain optimal stock and personnel before a spike in demand arises by acknowledging these insights.

- Slides: 19