Uses of NMR 1 NMR is a method
 NMR is a method of chemical analysis. (Who uses NMR")
 Basic principles of NMR. 2) NMR as a protein (and")
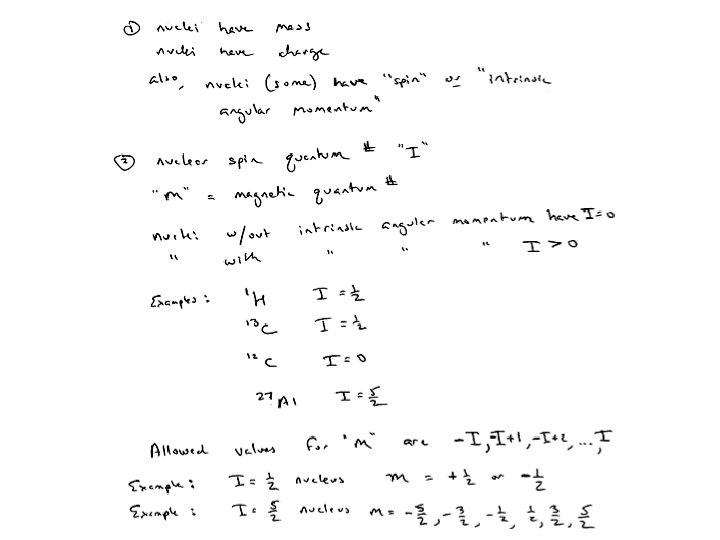
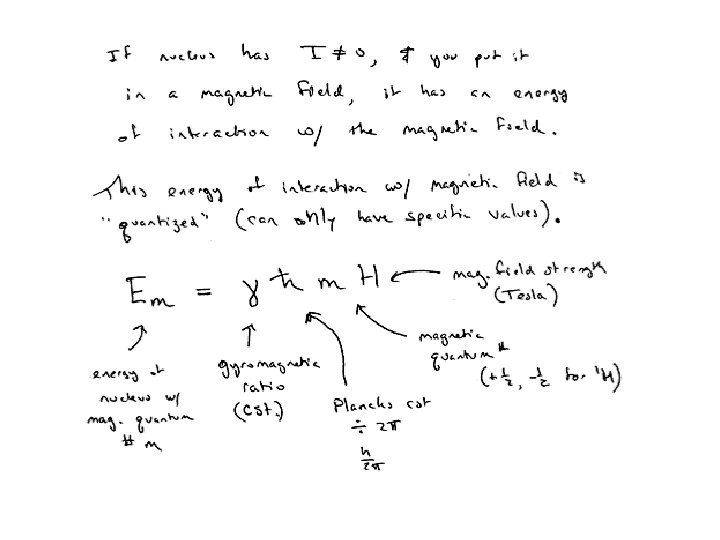
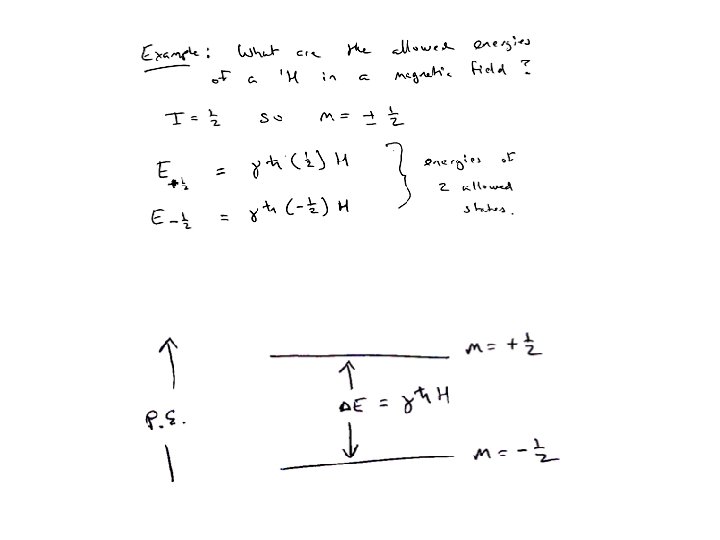
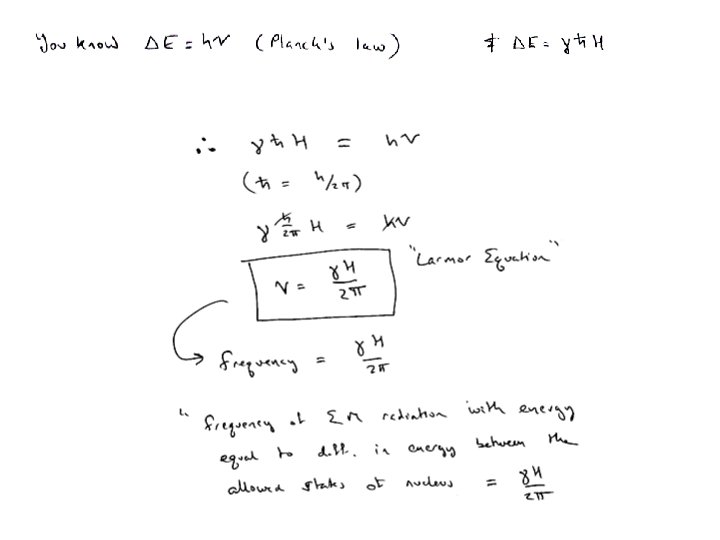


 through measurement of the “Nuclear")


- Slides: 27
Uses of NMR: 1) NMR is a method of chemical analysis. (Who uses NMR in this way? ) 2) NMR is used as a method for medical imaging. (called “MRI”) 3) NMR is used as a method for determining of protein, DNA, RNA structure. (one of only 2 possible methods for doing this)
Plan for today 1) Basic principles of NMR. 2) NMR as a protein (and DNA and RNA) structure determination method.
Summary -
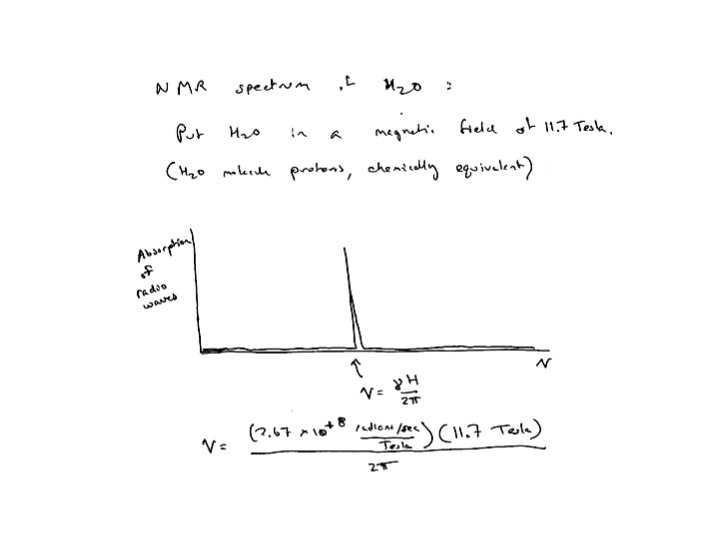
frequency Each H in the protein is in a unique magnetic environment, and can absorb (and emit) radio waves of a unique frequency.
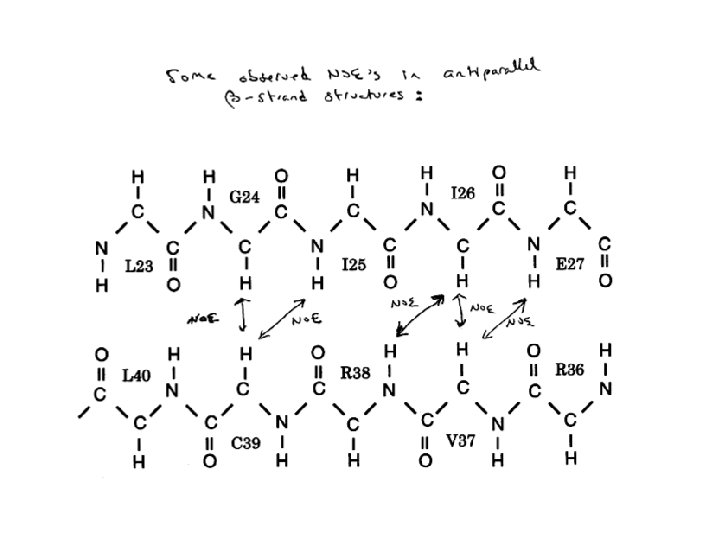
Protein structure information is derived from NMR data (primarily) through measurement of the “Nuclear Overhauser Effect” or “NOE” involving 1 H NMR signals. NOE = the change in the intensity of the NMR signal of one 1 H nucleus when the sample is irradiated with radiowaves at the NMR absorption frequency of another nearby 1 H nucleus.
The NOE can be illustrated by example. Consider the NMR spectrum of asparagine, as part of a protein: To see the NOE effect, the sample can be irradiate with RF waves at frequency 9 ppm: irradiate this frequency Observe intensity changes in nearby protons. This is the NOE. asparagine
One-dimensional NMR spectra are not useful for measuring the NOE in proteins, due to overlap in the 1 H spectra. It was necessary to invent two-dimensional (2 -D) NMR to measure the NOE (and hence 1 H-1 H distances) in proteins.
Illustrate the 2 -D NOE spectrum using asparagine as an example.
The 2 -D NOE spectrum of a 140 a. a. protein.
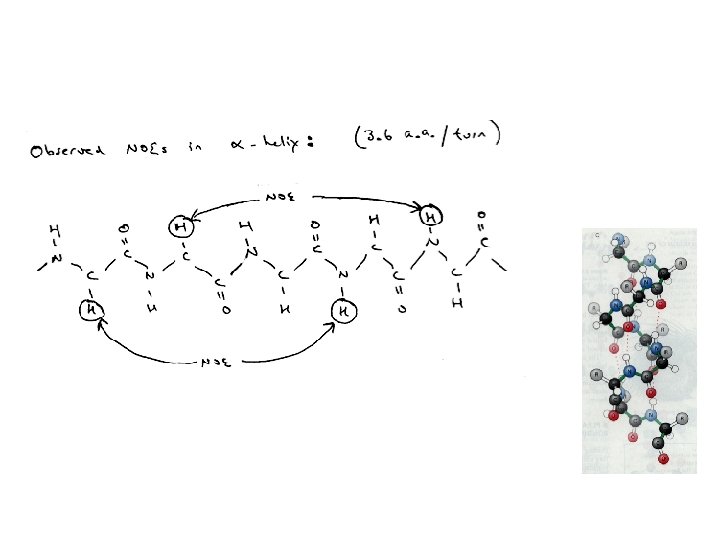
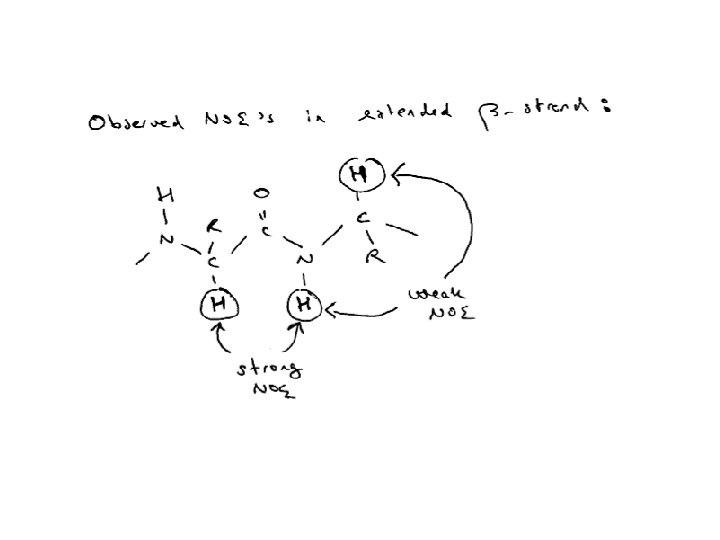
In summary: The 2 -D NOE spectrum provides information from which the distance between protons can be derived. How are NOE intensities converted to distances? Most commonly, a range of distances is used, something like: How are these distances calibrated? Usually by looking at NOE intensities in regular secondary structure, such as helix, where the distances are well known.
What goes into determining a protein structure from NMR data? A medium sized protein may contain 150 amino acids, and > 2000 atoms. NMR data may provide the distances between 1000 pairs of 1 H nuclei (from measured NOE peaks). Are 1000 1 H-1 H distances enough to determine the structure of this protein? Nope. What to do?
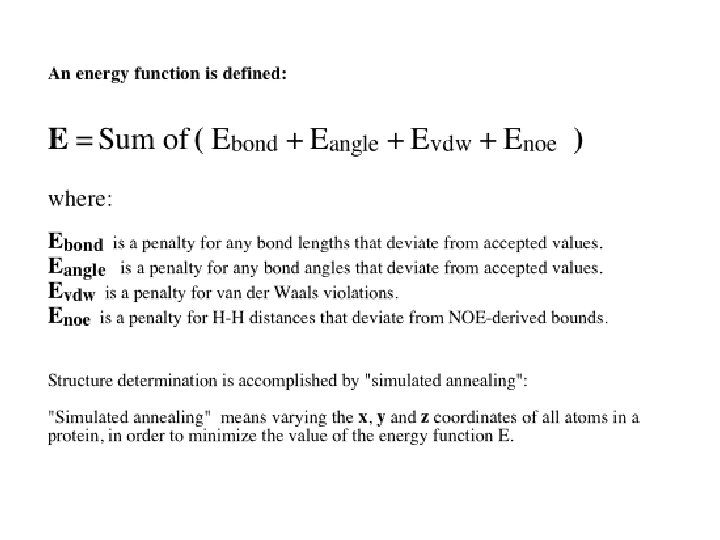
What else do we know about the protein structure, in addition to the 1000 1 H-1 H distances? Bond lengths can be assumed known. Many bond angles are known (tetrahedral carbons, planar rings). Van der Waals radii of atoms are known. How can these different types of information be combined to yield a structure?
Typical result of the “simulated annealing” process used for protein structure determination: This is a set of 12 super-imposed structures, all of which fit the NMRderived distance restraints equally well. In other words, these 12 structures all have the same value of “E” after the simulated annealing process.
Visualizing the protein structure.
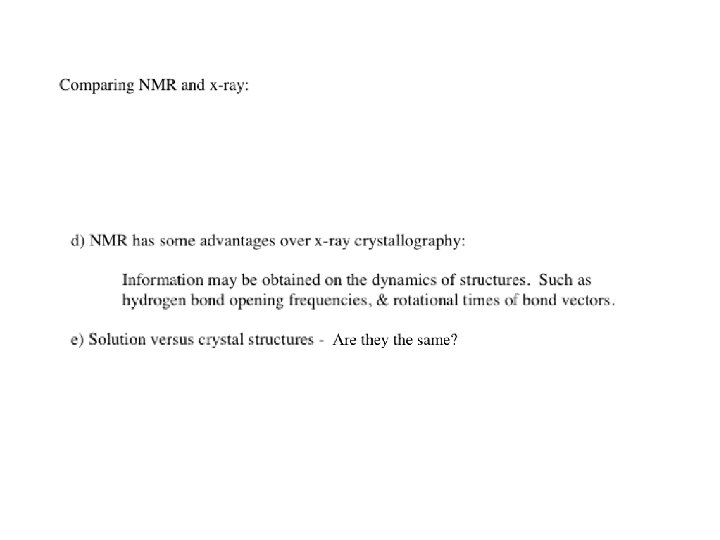
Are they the same?
With x-ray crystallography, the structure can be directly visualized. Compare this with NMR, where a family of possible structures is derived from a set of inter-proton distances, consistent with the observed NOE data.