
Use of the TCI questionnaire in General Practice








- Slides: 17
Use of the TCI questionnaire in General Practice: response rates and reliability Evan Kontopantelis Stephen Campbell David Reeves NPCRDC
Team Climate Inventory • 65 item measure with six subscales that attempts to quantify the working climate within a practice (Anderson & West, 1994) • All items on a scale of 1 to 5 • The six subscales (factors) are: Participation Task style Support for innovation Reviewing processes Objectives Working
Data collection • The questionnaire was distributed to all clinical, nursing and administration staff working in a sample of 60 practices in 1998 and 42 of the same practices in 2003 • Response rates varied greatly by practice number of practices average respondents per pract average resp rate per pract 1998 60 9. 5 63. 1% 2003 42 12. 2 65. 1%
The question • What level of response is required to obtain a reliable/accurate TCI subscore for a practice?
Data structure • Three levels: items, respondents & practices • But which is the exact form? – When each respondent in a practice evaluates a different set of items (e. g. “I generally prefer to work as part of a team”) I: R: P – When each respondent in a practice evaluates the same set of items (i. e. “My team has a lot of team spirit”) (I×R): P • Unfortunately the questionnaire is a mixture of both
Aggregate-level variables and reliability • Methods are based on concepts from the generalizability theory • The universe score is the score that an object of measurement – e. g. a practice – would receive on a characteristic – e. g. participation – if its score was based on the mean of all relevant predefined conditions of measurement – e. g. all possible respondents and questions (O’Brien 1990)
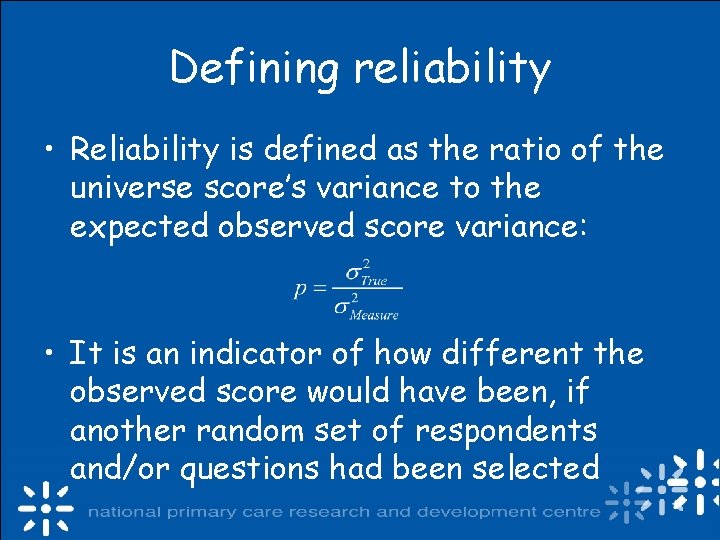
Defining reliability • Reliability is defined as the ratio of the universe score’s variance to the expected observed score variance: • It is an indicator of how different the observed score would have been, if another random set of respondents and/or questions had been selected
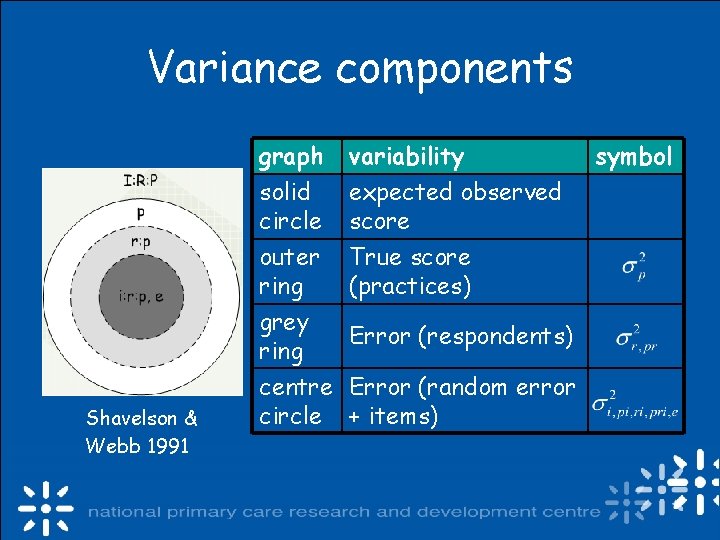
Variance components Shavelson & Webb 1991 graph solid circle variability expected observed score outer ring True score (practices) grey Error (respondents) ring centre Error (random error circle + items) symbol
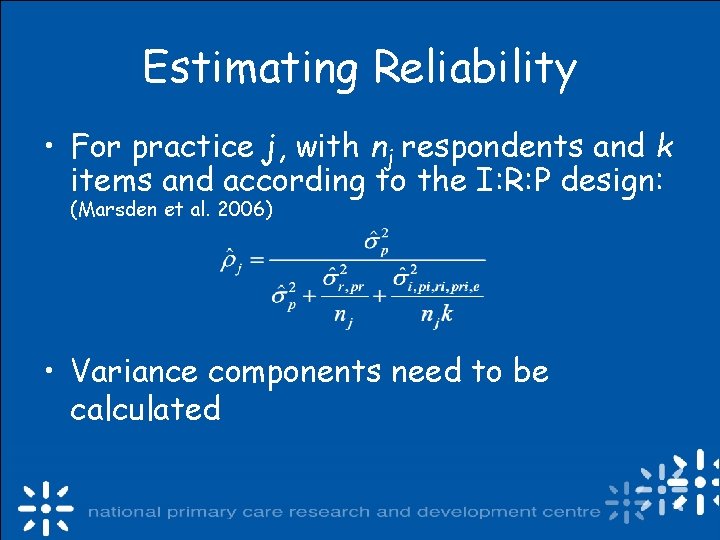
Estimating Reliability • For practice j, with nj respondents and k items and according to the I: R: P design: (Marsden et al. 2006) • Variance components need to be calculated
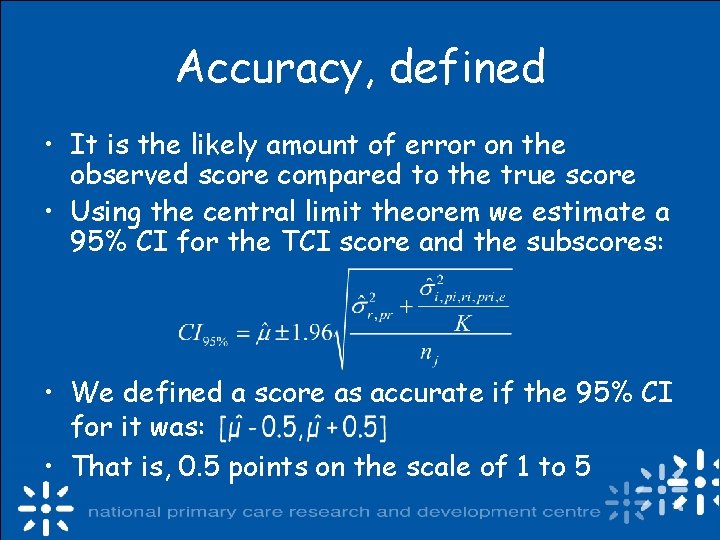
Accuracy, defined • It is the likely amount of error on the observed score compared to the true score • Using the central limit theorem we estimate a 95% CI for the TCI score and the subscores: • We defined a score as accurate if the 95% CI for it was: • That is, 0. 5 points on the scale of 1 to 5
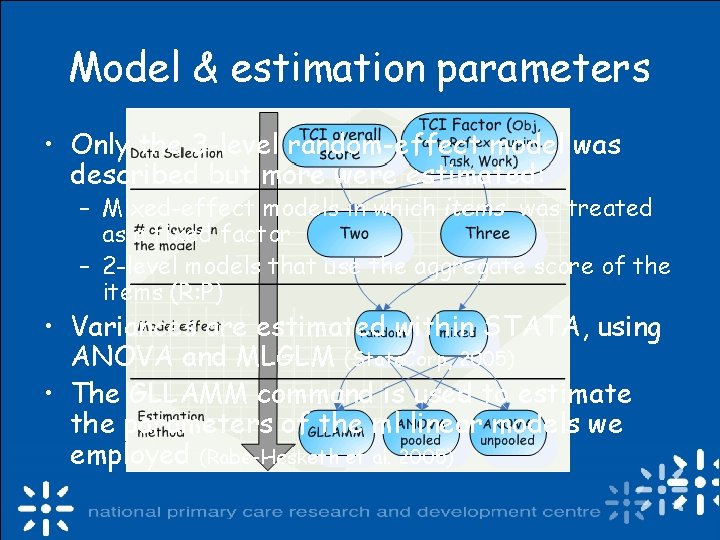
Model & estimation parameters • Only the 3 -level random-effect model was described but more were estimated: – Mixed-effect models in which items was treated as a fixed factor – 2 -level models that use the aggregate score of the items (R: P) • Variances are estimated within STATA, using ANOVA and MLGLM (Stata. Corp, 2005) • The GLLAMM command is used to estimate the parameters of the ml linear models we employed (Rabe-Hesketh et al. 2005)
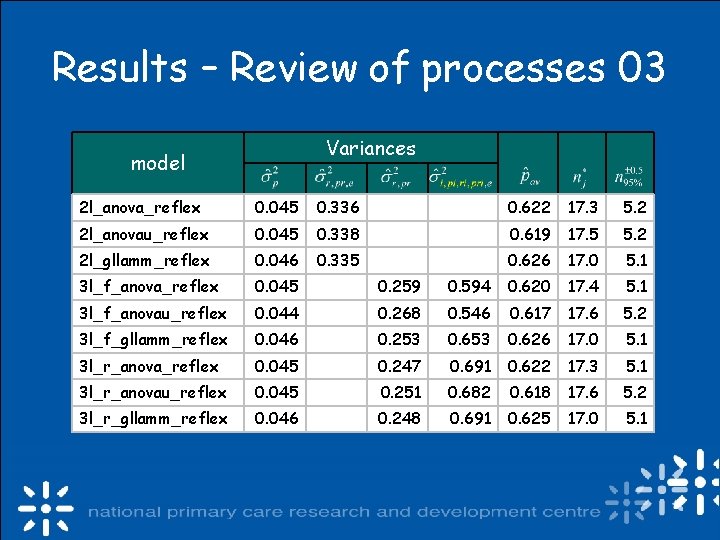
Results – Review of processes 03 Variances model 2 l_anova_reflex 0. 045 0. 336 0. 622 17. 3 5. 2 2 l_anovau_reflex 0. 045 0. 338 0. 619 17. 5 5. 2 2 l_gllamm_reflex 0. 046 0. 335 0. 626 17. 0 5. 1 3 l_f_anova_reflex 0. 045 0. 259 0. 594 0. 620 17. 4 5. 1 3 l_f_anovau_reflex 0. 044 0. 268 0. 546 0. 617 17. 6 5. 2 3 l_f_gllamm_reflex 0. 046 0. 253 0. 626 17. 0 5. 1 3 l_r_anova_reflex 0. 045 0. 247 0. 691 0. 622 17. 3 5. 1 3 l_r_anovau_reflex 0. 045 0. 251 0. 682 0. 618 17. 6 5. 2 3 l_r_gllamm_reflex 0. 046 0. 248 0. 691 0. 625 17. 0 5. 1
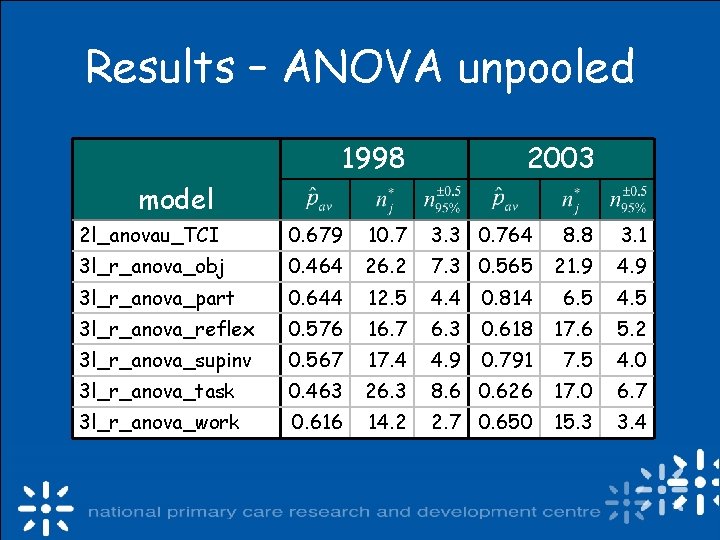
Results – ANOVA unpooled 1998 2003 model 2 l_anovau_TCI 0. 679 10. 7 3. 3 0. 764 8. 8 3. 1 3 l_r_anova_obj 0. 464 26. 2 7. 3 0. 565 21. 9 4. 9 3 l_r_anova_part 0. 644 12. 5 4. 4 0. 814 6. 5 4. 5 3 l_r_anova_reflex 0. 576 16. 7 6. 3 0. 618 17. 6 5. 2 3 l_r_anova_supinv 0. 567 17. 4 4. 9 0. 791 7. 5 4. 0 3 l_r_anova_task 0. 463 26. 3 8. 6 0. 626 17. 0 6. 7 3 l_r_anova_work 0. 616 14. 2 2. 7 0. 650 15. 3 3. 4
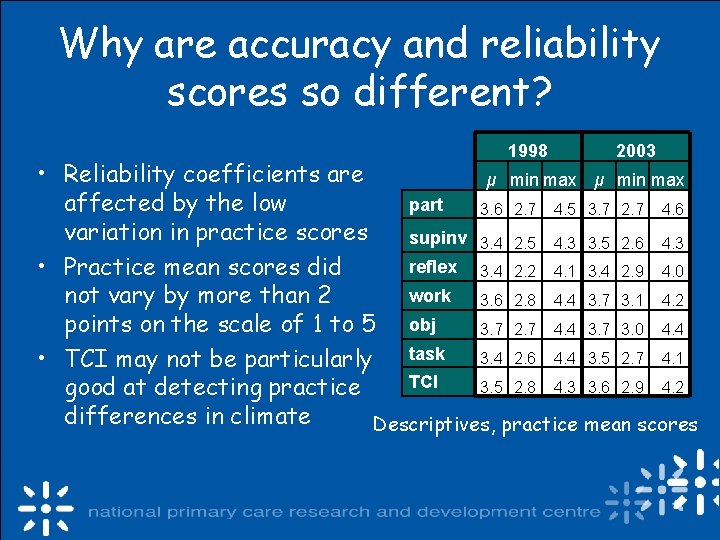
Why are accuracy and reliability scores so different? 1998 2003 • Reliability coefficients are μ min max part affected by the low 3. 6 2. 7 4. 5 3. 7 2. 7 4. 6 variation in practice scores supinv 3. 4 2. 5 4. 3 3. 5 2. 6 4. 3 reflex 3. 4 2. 2 4. 1 3. 4 2. 9 4. 0 • Practice mean scores did work not vary by more than 2 3. 6 2. 8 4. 4 3. 7 3. 1 4. 2 points on the scale of 1 to 5 obj 3. 7 2. 7 4. 4 3. 7 3. 0 4. 4 • TCI may not be particularly task 3. 4 2. 6 4. 4 3. 5 2. 7 4. 1 TCI 3. 5 2. 8 4. 3 3. 6 2. 9 4. 2 good at detecting practice differences in climate Descriptives, practice mean scores
Summary • TCI is a measure that attempts to quantify the working climate within a practice • Assuming that the I: R: P structure best describes our data we calculate: – the variances in the design – reliability & accuracy measures • Small between practice variances affect the reliability score but don’t affect the accuracy
Future work • Use of a finite population correction for practices • Examine the (I×R): P structure and compare results to the I: R: P one
References • Anderson, N. & West, M. A. 1994, Team climate inventory : manual and user's guide Windsor : ASE. • O'Brien, R. M. 1990, "Estimating the reliability of aggregate-level variables based on individual-level characteristics", Sociological Methods and Research; 18 (May 90) p. 473 -504 • Shavelson, R. J. & Webb, N. M. 1991, Generalizability theory : a primer Newbury Park ; London : Sage Publications. • Marsden, P. V. , Landon, B. E. , Wilson, I. B. , Mc. Innes, K. , Hirschhorn, L. R. , Ding, L. , & Cleary, P. D. 2006, "The reliability of survey assessments of characteristics of medical clinics", Health Serv. Res. , vol. 41, no. 1, p. 265 -283 • Stata. Corp 2005, Stata Statistical Software: release 9. 2 College Station, TX. • Rabe-Hesketh S. , Skrondal A. , & Pickles A. 2004, GLLAMM Manual U. C. Berkeley.