Urban Vulnerability Assessment Population Estimation Population Projection Needed

Urban Vulnerability Assessment Population Estimation

Population Projection � Needed for planning purposes � Length of time in the future for projections � Short term (up to 10 years) � Long term (up to 50 years) � Both depend on past records

Population Forecasting � Model to estimate population � Direct Method � Indirect Methods

Direct Method

Methods for Estimation � Graphical methods � Extrapolation � Least squares regression � Mathematical � Assumes methods that population growth follows a mathematical relationship

Population Growth � Population growth is generally considered to be exponential P=P 0 ert where: P = future size of the population at time t P 0 = current size of the population t = number of years for the extrapolation r = assumed constant rate for each of the t years
 is usually expressed as a")
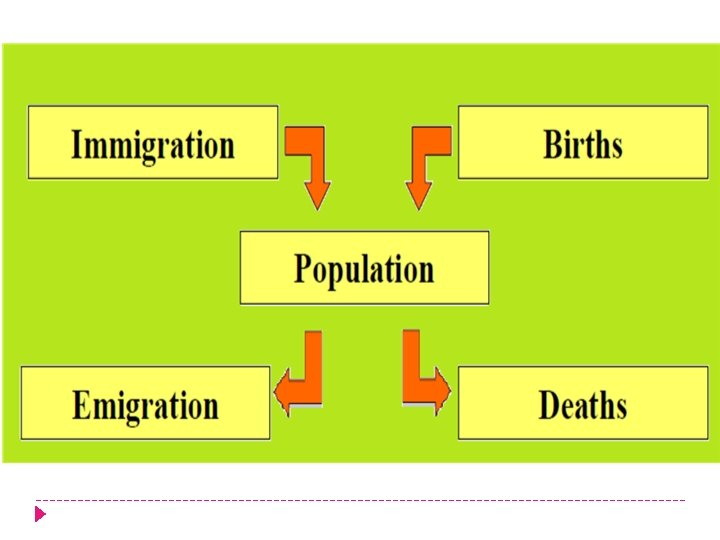
How to Calculate r? � The growth rate (r) is usually expressed as a fraction of the increase in population per year � Growth rate is also defined by the following equation: r=(b-d)+(i-e) where: b = birth rate d = death rate i = immigration rate e = emigration rate net migration = i-e Natural increase of population = b - d

Example: � The 2010 population in a town is surveyed and determined to be 50, 000. What would you predict the population to be in the years 2020 if birth rate is 40 persons / 1000 people (or 4 %), death rate 15 persons / 1000 and net migration is 10 persons / 1000 people?

Doubling Time � Double time represents the length of time for the population to double in size when growing with a constant growth rate (r) Tdb =70/r where: Tdb = the doubling time r = the constant growth rate in %

Indirect Method � Population estimate derived from: � Household counts and occupancy rate � School registered children � Residential area with population density � Roof Area Method

Source of Data � Existing registers: Census data, cadastral data, taxation data � Existing maps: Topo maps, cadastral map � Field surveys � Satellite images/aerial photographs � DEM and DSM (deriving building heights)

Statistics Characteristics � Number of inhabitants � Densities � Age composition � Gender distribution � Etc.

Dynamic Characteristics �Population �Activity is dynamic in space and time pattern �Distribution in space �Distribution in time

Daily Human Activities
- Slides: 15