Urban Data for Statistical Research Houston Urban Data

Urban Data for Statistical Research Houston Urban Data Platform Katherine B. Ensor, Director http: //kinder. rice. edu/Urban. Data/

What if… • You had 2000+ data sets for one metropolitan area… • Data on residents (all aspects), the built environment, the physical environment…. • The data sets were all linked in time and space…. • The data were curated and research ready… • The data were regularly updated…. What questions can the statistician answer? And where are the limitations?

Houston UDP Geo-referenced Downloadable Data • Interface – web-portal • Non-secure data can be downloaded • There will be a distinction made between UDP curation and contributor curation • Expectation is that data will be cited when used.

HOUSTON UDP SECURE SYSTEM • HIPAA compliant data library focused on Houston • Geocoded for easy links • Cleaned & research ready data • Servers housed at Rice • Analysis software tools • Esri Arc. GIS, Python, R, SAS, Stata, Tableau • User Access • Virtual Private Network (VPN)/ Virtual Desktop Infrastructure (VDI) • Web portal • A few high performance desktops

The value of Curated Data • Vetted • Cleaned and research ready • Geo-referenced allowing linking across multiple data sets by shared geography • Regular update schedule • PUBLISHED and ARCHIVED • A ONE STOP SHOP….
 • A DOI is a unique, registered string for persistent")
Digital Object Identifier (DOI) • A DOI is a unique, registered string for persistent identification of digital content and associated metadata. • Kinder will pursue minting DOIs for each published dataset through Data. Cite in collaboration with Fondren Library. Prefix [allocated] Suffix [chosen by institution] http: //dx. doi. org/10. 4683/udp. 07. 034 URL of DOI Foundation Server DOI Registrant registry (Rice University) Digital Object (UDP dataset identifier)

Houston Community Data Connections • A participant in the National Neighborhood Indicators Partnership • A collaboration of the Urban Institute and partners in 30 cities to further the development and use of neighborhood-level information systems for community building and local decision making. • Approximately 100 neighborhood indicators • For the most part, summary statistics (means) by super neighborhoods • Many entities will make inferences from these indicators.

Three outlets for Houston data via the Urban Data Platform • UDP HIPAA compliant server. • Controlled access. Vetted and trained users. • Contains data at the individual level. • UDP Geo-referenced non-secure data server. • Open access – registration required • Data published and should be cited when used. • HCDC neighborhood indicators • Open access • Data may or may not be published. • Used for community development.

Key challenges to building these systems • Technology – local servers and/or cloud computing • Regular updating – sustainability • Legal, legal and legal … oh and then there are the legal aspects • Management and oversight -- CRITICAL • Credit for effort • Cross-system linking? Would open up significantly more opportunities.

Understanding our cities is worth the effort. Important that our statistics research answer the right question, or clearly indicate why we cannot.

Examples: Answering the RIGHT question 1. Cardiac Arrest: Are lives saved by expanding the EMS response to cardiac arrest calls to include response by fire fighters? 2. Can we reduce the asthma incidents of students in the Houston Independent school districts? Are these incidents related to ambient air quality? 3. How has Houston land use changed in the last 20 years?

CARDIAC ARREST EMS + Fire Response • DATA: 911 EMS response to cardiac arrest in Houston • Cardiac arrest first responders • Augmenting the EMS network with response by fire personnel decreases the overall emergency response time.

Saving lives • The expedited response time by firemen increases the return of spontaneous circulation of cardiac arrest patients. • Blue is good! • Statistical analysis confirmed the added benefit of fire personnel.

EMS Data + Air Quality • GOAL: Reduce frequency of childhood asthma EMS calls by better managing care • Collaboration with City of Houston and HISD • Identified the air quality mixture that produces a measurable increase in the frequency of EMS calls for asthma. • Developed an air quality alert network and readiness plan for actionable days.

Understanding Air Pollution and Asthma NO 2 and Ozone matter

Temporal Dynamics are IMPORTANT 7 am 2 pm Toward a Dynamic Multi-Pollutant Model Pollution mixture changes throughout the day 3 Years of Hourly Observations K. B. Ensor / ensor. rice. edu Correlations change locally in time
")
Identified air quality mixture when asthma incidents are high • Data utilized (10+ years) • 911 call for treatment of asthma attack; individual information available • Daily aggregate air quality measurements at 40 fixed monitors (created from hourly measurements) • Meteorological variables • Missing --- pollen • What population is represented? What are biases? • Multiple statistical strategies implemented • • Developed “daily” pollution measures Case-crossover to find an effect --- both NO 2 and Ozone are key Pollution levels identified through extensive case-crossover relative risk comparisons Working now on a refinement of the “levels” using daily counts of asthma incidents.

Program with HISD and Houston Health Department: Example email

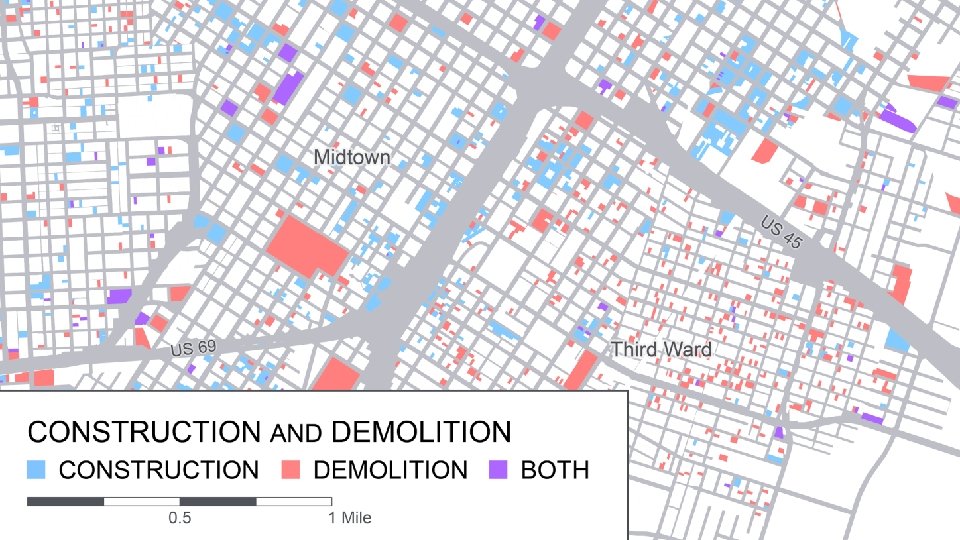
“How” is Houston growing? A dynamic city and community o where are farms and forests being converted to urban areas? o where are urban areas growing denser? o how fast are these changes occurring? Hakkenberg et al, 2017
 and then (1997)")
Now (2016) and then (1997)

Distilling Harris County Appraisal District Data • Kelsey Walker and Kyle Shelton, Kinder Inst. • Kinder Institute report and interactive map Houston. In. Flux. com • Collaborations: • National Trust for Historic Preservation: Character Score • Reinvestment Fund: Market Value Analysis • UDP team spent extensive effort “cleaning” the HCAD data – this it at the core of all geospatial analyses.

The VALUE of Local • Shout for a local urban analytics • Value in controlled access to sensitive data • Requires local advanced analytic abilities • Or improved, easy access, software that incorporates key statistical issues • Incorporate more inference structure into GIS software • Develop a toolkit identifying when analyses have gone astray • Move the general users beyond descriptive statistics and mapping

Key Statistical Challenges • Observational data with inherent bias • Security of individual level data • Data quality • Space / time • Different scales • Complex dependence structure is too often ignored. • TYPE of spatial structure --- distance metric can be important • DON’T forget time • Data mixtures • Working with aggregated data --- can we do MORE not less here? ? • Needed: simple fixes for standard methods that are easily accessible; more roadmaps to follow – in a world of “uncontrolled” use.

Urban Analytics: Needed Innovation • Renewed interest in sampling and issues of data representation • Linking across platforms • Is there a way to perform key analyses that cross secure platforms? Or non-secure but protected platforms? • Strategies • Solving the “security” issues • Statistical solution … what information is essential to answer questions as if you were linking at the individual level? • A CALL TO THE STATISTICAL COMMUNITY • Increase the use of synthetic data

Urban Analytics… What if …. you had 2000+ data sets for one metropolitan area… What questions can the statistician answer? And where are the limitations? Thank you to Houston Endowment, Inc. for support of this effort. http: //kinder. rice. edu/Urban. Data/ http: //ensorgroup. blogs. rice. edu Thank you ensor@rice. edu
- Slides: 26