UPPER MERION AREA SCHOOL DISTRICT STUDENT ACHIEVEMENT REPORT

 in Pennsylvania • Adequate Yearly Progress (AYP), as part")


- Slides: 33
UPPER MERION AREA SCHOOL DISTRICT STUDENT ACHIEVEMENT REPORT PRESENTED BY JANE CALLAGHAN NOVEMBER 1, 2010
About Adequate Yearly Progress (AYP) in Pennsylvania • Adequate Yearly Progress (AYP), as part of the federal No Child Left Behind Act (NCLB), holds LEAs accountable to students, their parents, teachers, and the community. The purpose of AYP is to ensure that all students have reading and math skills that prepare them for the future. The law states that all students must reach the Proficient level or higher in Reading or Language Arts and Mathematics by 2014. • AYP measures determine whether a school or district is making sufficient annual progress towards the goal of 100% proficiency • AYP measures student results for three indicators – Attendance (for schools without a High School graduating class) or Graduation Rate (for schools with a High School graduating class) – Academic Performance – Test Participation • 2010 Targets 56% Proficiency in Mathematics, 63% Proficiency in Reading • 2011 Targets 67% Proficiency in Mathematics, 72% Proficiency in Reading
AYP requires that all groups of children reach proficiency in Reading or Language Arts and Mathematics – hence the phrase "no child left behind". These groups include all racial and ethnic backgrounds, students who are English Language Learners, economically disadvantaged students, and special education students. (When these subgroups contain fewer than 40 students, the subgroup is not separately evaluated for AYP)- UMASD Demographic Numbers by Testing All Students 1877 Female 939 Male 938 American Indian or Alaskan Native 1 Asian or Pacific Islander 268 Black/African American non. Hispanic 168 Latino/Hispanic 117 White non-Hispanic 1311 Multi-Racial/Ethnic 12 IEP-Special Education 252 Migrant Education Program 0 Economically Disadvantaged 353 English Language Learner 37
ALL UMASD Schools Made AYP
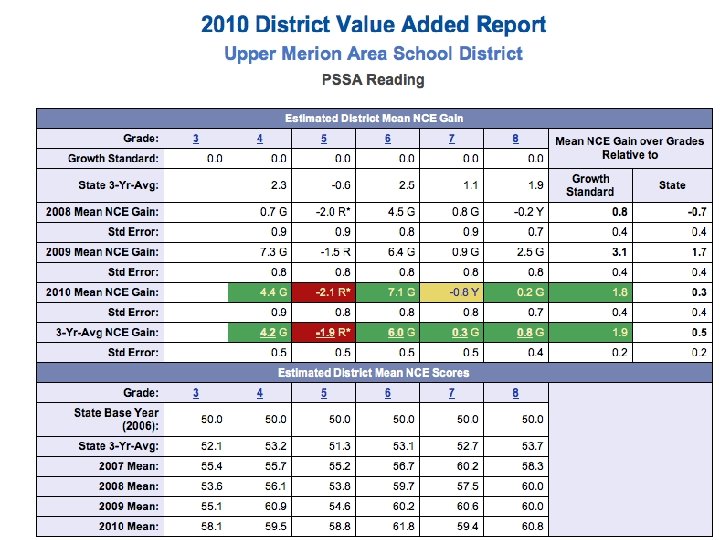
Reading District and State Performance By Grade 2010
Reading District and State Performance Three Year Progress
Reading Performance 2010 Distribution by Reading and Student Group
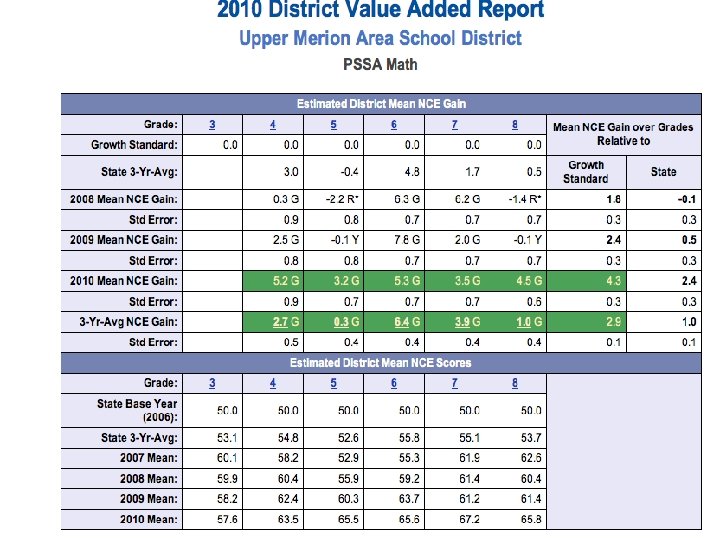
Mathematics District and State Performance By Grade-2010 Grade 1 2010
Mathematics District and State Three Year Progress
Mathematics Performance 2010 Distribution by Mathematics and Student Group
Science, 2010
Writing, 2010
Bridgeport Elementary School, 2010 Mathematics Grades 3 and 4
Caley Elementary School, 2010 Mathematics Grades 3 and 4
Candlebrook Elementary School, 2010 Mathematics Grades 3 and 4
Roberts Elementary School Mathematics Grades 3 and 4
UMASD Middle School Mathematics by Grade, 2010
Bridgeport Elementary School, 2010 Reading Grades 3 and 4
Caley Elementary School, 2010 Reading Grades 3 and 4
Candlebrook Elementary School, 2010 Reading Grades 3 and 4
Roberts Elementary School Reading Grades 3 and 4
UMASD Middle School Reading by Grade, 2010
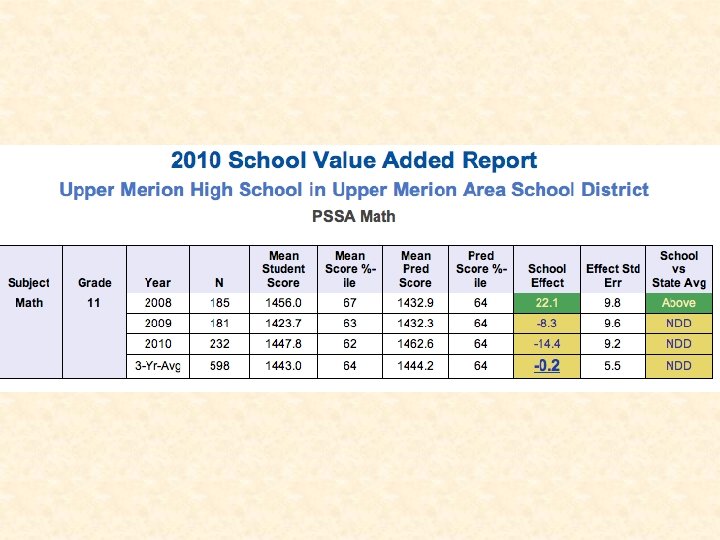
UMASD High School
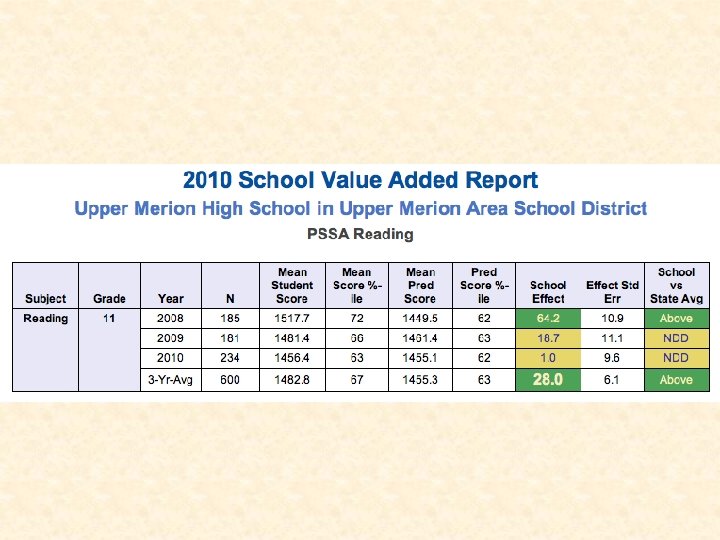
UMASD High School Reading
UMASD High School and County Mathematics Harriton SHS Lower Merion HS Abington SHS North Penn SHS Lower Moreland HS Upper Dublin HS Souderton Area SHS Jenkintown M/HS Spring-Ford SHS Hatboro-Horsham SHS Methacton HS Springfield Plymouth-Whitemarsh Wissahickon SHS Perkiomen Valley HS Upper Merion HS Upper Perkiomen HS Cheltenham HS Pottsgrove SHS Upper Moreland HS Pottstown SHS Norristown Area HS 16 th out of 22 schools Reading 87. 2 84. 4 81. 1 79. 6 79. 2 78. 7 78. 2 77. 3 76. 4 76. 1 75. 2 75. 1 74. 4 72. 2 71. 8 67. 7 67. 4 65. 1 57. 3 56. 7 52. 8 40. 4 Jenkintown M/HS Lower Merion HS Harriton SHS Springfield Lower Moreland HS Abington SHS Wissahickon SHS Upper Dublin HS Souderton Area SHS Methacton HS Perkiomen Valley HS Plymouth-Whitemarsh Spring-Ford SHS Hatboro-Horsham SHS Upper Perkiomen HS North Penn SHS Cheltenham HS Upper Merion HS Upper Moreland HS Pottsgrove SHS Pottstown SHS Norristown Area HS 18 th out of 22 schools 93. 7 91. 5 91. 3 86. 7 86. 6 85. 3 83. 2 82. 4 81. 8 81. 7 81. 5 78. 1 78 77. 2 76. 6 75. 7 74 68. 3 67. 2 59. 4 50. 1
SAT SCORES, 2010 Test Takers Critical Reading Math Writing Number Mean-District Mean 204 503 518 488 Number Mean-State 104, 593 492 501 480 Number Mean-Total 1, 547, 990 501 516 492
Achievement and Growth • PSSA/Achievement…PVAAS/Growth – As PVAAS analyses utilize the PSSA assessment data, PVAAS growth reports are available in (1) Math and Reading for grades 4 through 8, and 11; (2) Science for grades 4, 8, and 11; and (3) Writing for grades 5, 8, and 11. These are the grade levels in which the PSSA is administered. Even though the PSSA is administered in grade 3, PVAAS growth reports are not available for these cohorts. As grade 3 is the first year of state testing, there is no prior history from which to calculate a measure of growth. – For grades 4 through 8 in Math and Reading, students are tested with the PSSA in consecutive years. This Value. Added Report is based on the Growth Standard Methodology. – For Science, Writing, and grade 11 Reading and Math, students are not tested in consecutive years. This Value. Added report is based on the Predictive Methodology.
Data Informs Our Planning • The Data is regularly reviewed analyzed • Interim data is used in the form of diagnostic assessments, benchmark assessments, formative and summative assessments • Data relative to student achievement gaps is used to inform curriculum, text selections, teaching styles • Research informs our planning
Data Informs Our Planning • Teachers have been involved in data analysis and use of data for instructional decision making • Both the middle school and the high school have built intervention courses into their schedules • The high school has been following a multi-year plan to collapse academic courses and to have all students engaged in a rigorous curriculum • Staffing remains a priority in the area of reading, special education and ESL • Professional development is designed based upon student need: Focus on Math/Differentiated Instruction/Technology