Upper Air Analysis 850 700 500 250 h


: 850")


 Examples of height codes: 75 means")


 Plotted for winds ≥ 60 kts 12 Z CMC 250 h.")

 & Low")

: § Look at the height contours:")


- Slides: 45
Upper Air Analysis 850, 700, 500, 250 h. Pa charts 1
Upper Air Charts Objectives • Review Upper Charts • Identify features on Upper Charts 00 Z CMC 850 h. Pa 30 Jul 2008 2
Why use Upper Air Charts? § Weather usually develops throughout the depth of the Troposphere § Most Synoptic weather is actually due to forcing aloft (upper lows/trofs/fronts) § These features are often (but not always) reflected in the SFC analysis § Upper charts are vital in overall analysis (3 -D diagnosis) 3
Upper Air Charts n Data displayed on a “horizontal slice” of the atmosphere n For each radiosonde launch: one data point n Horizontal slice can be taken at various heights of the atmosphere n However instead of heights the norm is to use “constant pressure levels” 4
Why Pressure Levels? § Historically A/C flew at Pressure Altitudes § Still true for flights >18 Tft (no Altimeter recalibration) § Radiosondes report in terms of pressure (height is calculated from other parameters) § Computation is easier using Pressure levels. 5
H 850 h. Pa Pressure Surface > 1500 m < 1500 m L SEA LEVEL 6
L 1380 m L L 1440 m 1500 m 12 Z 29 Jul 2008 850 h. Pa Upper Air Stations L 7
Rejected Data Types of rejected data n Reasons why data is rejected n Discussion n Exercise - find rejected data n 8
Limitations What’s not represented n Friction at low levels n Sharpness/ Smoothing Like Td, heights n 9
What’s typically analyzed The standard Pressure Levels used by most meteorlogical organizations (MSC): 850 h. Pa (near 5000 ft / 1500 m) – Thermal advection, fronts, low level jets, moisture 700 h. Pa (near 10, 000 ft / 3000 m) – Thermal advection, fronts, moisture 500 h. Pa (near 18, 000 ft / 5000 m) – Steering flow, vorticity advection, fronts 250 h. Pa (near 34, 000 ft / 10, 000 m) – Jet Streams n Issued twice daily: 12 Z (14 -16 Z) & 00 Z (02 -04 Z) 10
CMC Upper Air Plots 850 h. Pa T T-Td Examples of height codes: 79 means 1790 metres Height 50 means 1500 metres 24 means 1240 metres 700 h. Pa T T-Td Examples of height codes: Height 30 means 3300 metres 00 means 3000 metres 74 means 2740 metres 11
Upper air plots n n WD - Wind direction (plotted to 36 compass points, or tens of degrees; indicates the direction from whence the wind originates). WS - Wind speed (knots, where a short barb indicates intervals of 5 knots, a long barb indicates 10 knot increments, and a flag indicates 50 knot increments). 12
Upper air plots n TT -Ambient air temperature rounded to the nearest whole °C; "-" for T < 0°C. n DD - Dewpoint depression or spread = T - Td, rounded to the nearest whole °C. 13
K W K 10°C Isotherm 12 Z CMC 850 h. Pa Temperature 29 Jul 2008 16
Exercise n Draw the ___ degree isotherm on 850 n Draw the ___ degree isotherm on 700 18
500 h. Pa charts n 500 h. Pa vorticity n 500 h. Pa thickness 19
CMC Upper Air Plots 500 h. Pa (Vorticiy) Examples of height codes: 75 means 5750 metres T Height 40 means 5400 metres T-Td 500 h. Pa (Thickness) T T-Td 96 means 4960 metres Height Fig. D 1. 2 Plots on upper charts. 20
500 h. Pa Vorticity n n n Troughs and ridges are most easily identified at this pressure level. Clouds and precipitation frequently accompany upper-level lows and troughs, even without surface frontal systems. Shortwave troughs, are often embedded in the Rossby flow, and will propagate at speeds of 20 to 40 knots. Most surface lows and fronts are associated with upper-level short-wave troughs. 22
CMC 500 h. Pa Vorticity Line of constant Vorticity 23
500 h. Pa Thickness § The 534 -540 dam thickness is an approximate RA/SN line § This is indicative of the average temperature of the column of air under the 500 h. Pa pressure level. Larger thicknesses indicate warmer air. 24
W K Line of constant 1000 -500 h. Pa Thickness 00 Z CMC 500 h. Pa 1000 -500 Thkns 30 Jul 2008 26
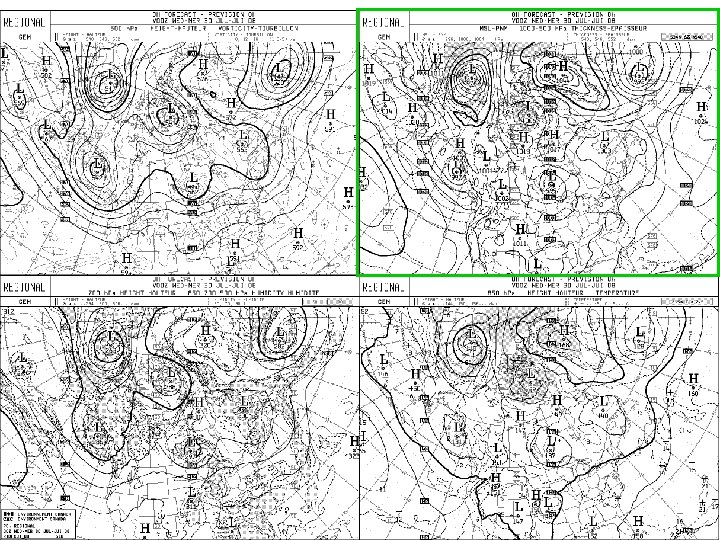
00 Hr PROG MSLP & 1000 -500 Thkns Valid 00 Z 30 Jul 2008
250 h. Pa or 300 hpa Jet Streams 28
PLOTS ON UPPER CHARTS 250 h. Pa T Height Examples of height codes: 80 means 10, 800 metres 20 means 10, 200 metres 90 means 9, 900 metres T-Td 29
Jet streams Normally, the greatest winds are found above the regions of strongest horizontal temperature contrasts, and hence, in the tightest contour packing. n A “Jet” is often found in segments n – 1, 000 to 3, 000 miles long – 100 -400 miles wide. – 3, 000 -7, 000 feet deep 30
Isotach (constant wind) Plotted for winds ≥ 60 kts 12 Z CMC 250 h. Pa Isotachs 29 Jul 2008 31
Enhancing Upper Charts and Exercises 32
Enhancing 850 h. Pa and 700 h. Pa CHARTS 1. High (blue) & Low (red) symbols 2. 0°C isotherm (red) 3. Areas of moisture: • • Any stations reporting T-Td of 4 or less Highlight the station in Green 4. Areas of Warm/Cold Advection 33
Thermal Advection § Look for areas where the isotherms cross the contours and form closed “rectangles” (solenoids) § An area of thermal advection is bordered by 2 separate Isotherms & 2 separate height contours § The smaller the solenoid the more intense the advection 34
Thermal Advection Identifying advection type (warm or cold): § Look at the height contours: § § find the direction of flow (“Low to your left wind at your back”) the wind will push the isotherms in that direction § If air blows from warm to cold it is warm air advection § If air blows from cold to warm it is cold air advection § Identifying Warm and Cold “pools” will very helpful in this process 35
TEMPERATURE ADVECTION -10 L -5 K H W 15 0 5 10 36
H LW W K L H 850 h. Pa 12 Z W 37
L H LW W L K L 700 h. Pa 12 Z 38
CMC 12 Z 700 h. Pa Analysis L K L H W 40
Enhancing 500 h. Pa Charts § 500 h. Pa is referred to as the “Steering Flow” § 500 h. Pa Vorticity chart: § Analyze S/W Trofs and Ridges 41
250 h. Pa Upper level jets 44
Review Upper Air Charts n 850 & 700 h. Pa – Advections – Moist/saturated stations (T-Td = 4 or less) – 0 degree Isotherm n 500 h. Pa (steering flow) – Vorticity: S/W Trofs and Ridge – Thickness: 534 -540 dam thickness area n 250 h. Pa – Jet Isotachs (>60 kts) – Jet Axis(es) 50
NEXT: Upper Chart Exercise 51
Exercises Highlight the following features on the upper air charts provided: 850 & 700 h. Pa – – – Low/High labels 0°C Isotherm Saturated upper air stations Warm/Cold pools Thermal advections 52
Exercises Highlight the following features on the upper air charts provided: § 500 h. Pa Vorticity chart: § Analyze S/W Trofs and Ridges 53
Highlight the following features on the upper air charts provided: 250 h. Pa – Isotachs – Jet axes 55
Other websites for the description of upper air charts http: //weather. unisys. com/upper_air/det ails. html n http: //www. gis. usu. edu/~av 3250/BMET_ 3250_sp 2001/lab 12/UPPER_AIR_ANA LYSIS_instructions_00. htm n http: //josephbartlo. net/articles/021799. htm n 56
Online tools n Weather. Office http: //www. weatheroffice. gc. ca/canada_e. html n Aviation Digital Data Service (ADDS) www. adds. aviationweather. noaa. gov n Storm Chaser Machine http: //www. stormchaser. niu. edu/machine/ 57
58