Updated 52016 Louisiana Board of Regents The Board

Updated 5/2016

Louisiana Board of Regents The Board of Regents coordinates the efforts of the state's 33 public degree-granting institutions through planning, policy-making, and operations. The 1974 Louisiana Constitution gives the Board of Regents the following authority: ü To review or eliminate existing degree programs or departments; ü To approve, disapprove, or modify proposed academic programs or departments; ü To study both the need for and feasibility of new postsecondary institutions as well as the conversion of existing schools into campuses offering more advanced courses of study; ü To formulate and update a master plan for higher education (which must include a higher education funding formula); and ü To review annual budget proposals for the operating and capital needs of each public institution. 2

3

Louisiana Graduates for Louisiana Jobs Louisiana's High-Demand Job Openings 16% 84% Post-Secondary Credential or Some College Required High School Diploma or Less 1. 1 million Louisianians can not meet the basic requirements to apply for Louisiana’s top jobs. Source: Louisiana Workforce Commission Long-Term Occupational Forecast

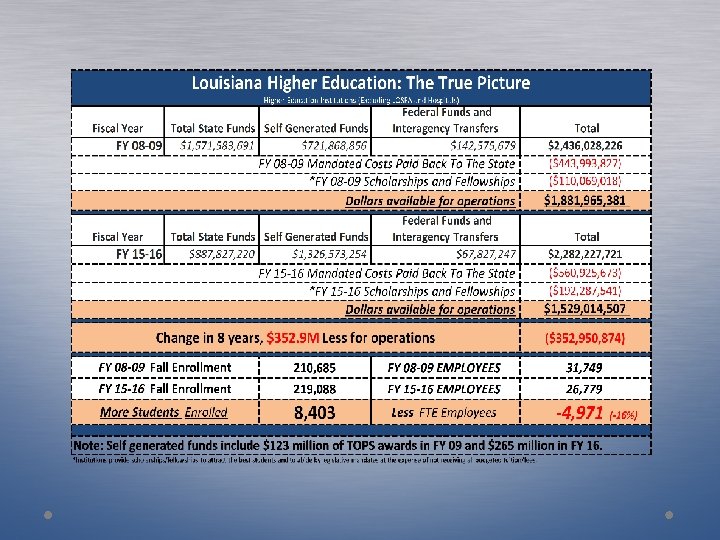
Louisiana Higher Education’s Lack of Funding Stability

Louisiana Topping The Wrong List Leading the Nation in Higher Education Disinvestment State support for higher education has been reduced by nearly 44% and nearly 20% considering all sources of funding. Source: Bo. R Finance Data

Budget Cuts = Increased Tuition & Fees • Since 08 -09: Ø Tuition and fees have increased approximately 99% while funding has been reduced (44% state / nearly 20% all sources). Ø Cost burdens for higher education has shifted from the state to students and families. • Tuition & Fee Increases 4 -year institutions +$3, 646 *Based on annual average per full-time student Source: Board of Regents Average Tuition and Fees Comparison • Tuition & Fee Increases 2 -year institutions +$1, 821

Funds for Operations Per Full-Time Equivalent Student Significantly Lower than SREB Average (All 4 -Year Institutions) $ 16 000 $ 14 000 $ 12 000 $ 10 000 SREB States $ 8 000 Louisiana $ 6 000 $ 4 000 $ 2 000 $2008 -2009 -2010 -2011 Source: SREB Southern Regional Education Board 2011 -2012 -2013 -2014*
 State General Purpose")
Funds for Operations Per Full-Time Equivalent Student (All 4 -Year Institutions) State General Purpose Net Tuition & Fee Revenue Source: SREB Southern Regional Education Board

Funds for Operations Per Full-Time Equivalent Student Significantly Lower than SREB Average (All 2 -Year Institutions) $ 8 000 $ 7 000 $ 6 000 $ 5 000 SREB States $ 4 000 Louisiana $ 3 000 $ 2 000 $ 1 000 $2008 -2009 -2010 -2011 Source: SREB Southern Regional Education Board 2011 -2012 -2013 -2014*
 State General Purpose")
Funds for Operations Per Full-Time Equivalent Student (All 2 -Year Institutions) State General Purpose Local Net Tuition & Fee Revenue Source: SREB Southern Regional Education Board

HIGHER EDUCATION MANDATED COSTS EXCEED $550 M 63 cents of every dollar allocated to Higher Education now goes back to the state for mandated costs FY 2008 -09 FY 2015 -16 $ Change % Change $53, 307, 971 $51, 380, 489 ($1, 927, 482) -3. 61%% Civil Service/CPTP $1, 279, 386 $1, 200, 316 ($79, 070) -6. 18% Legislative Auditor $3, 986, 205 $6, 134, 442 $2, 148, 237 53. 89% $61, 583, 411 $66, 037, 417 $4, 454, 006 7. 23% $131, 227, 496 $214, 190, 296 $82, 962, 800 63. 22% $18, 984, 958 $26, 286, 551 $7, 301, 593 38. 46% $115, 175, 382 $109, 044, 869 ($6, 130, 513) -5. 32 $58, 449, 018 $80, 678, 685 $22, 229, 667 38. 03% LCTCS (Other) $0 $344, 814 100% EACMC – Retiree/ORM $0 $3, 424, 035 100% HPLMC – Retiree/ORM $0 $2, 203, 769 $2, 203, 759 100% $560, 925, 673 $116, 931, 846 26. 35% Office of Risk Management LASERS Teachers’ Other Retirement Group Insurance – Active Group Insurance - Retirees Total $443, 993, 827 Source: Board of Regents - Submitted by Systems

63¢ of every $1 in state higher education funding goes to back to the state for mandated costs $ $ State Support Mandated Costs $887, 827, 220 - $560, 925, 673 $326, 901, 547 *State support number includes LCTCS pass through and rapid response funds Source: Board of Regents Average Tuition and Fees Comparison Remaining state support for higher education

Deferred Maintenance • Deferred maintenance costs for higher education exceeds $1. 5 B dollars. • Higher education funding to maintain its facilities has decreased 96% since 2008. Source: Board of Regents

Increasing Demand for our Graduates

In 2015, Louisiana high school graduation rates reached an all time high … but public higher education enrollment is the lowest since 2009 Largest Enrollment Since 08 -09 228 930 223 815 224 887 228 872 221 110 219 016 215 170 210 613 Formula Fully Funded Fall 2008 Fall 2009 Fall 2010 Fall 2011 Fall 2012 Fall 2013 Fall 2014 Fall 2015 Total fall headcount enrollment (Includes students enrolled at technical, two-year, four-year and specialized institutions) Source: Board of Regents

+15, 500 GRADUATES NEEDED BY 2025 Bo. R Master Plan Educational Attainment Goal of 46% 60000 To get to 46%, the State needs to produce 1, 629 additional graduates per year (compounded) from 13 -14 through 2025 - an annual growth rate of 5. 6% 50000 40000 Actuals 30000 If we continue our avg. rate of growth in graduates (3. 5%) we would add 847 additional graduates per year and achieve a 40% educational attainment rate by 2025 NCHEMS May 2014 Current Trajectory -2 23 3 -2 24 4 -2 25 5 -2 6 22 -2 2 21 -2 1 20 -2 0 19 -1 9 18 -1 8 17 -1 7 16 -1 6 15 -1 5 14 -1 4 13 -1 3 12 -1 2 11 -1 1 10 -1 0 09 -0 9 08 -0 8 07 06 -0 7 20000

250 000 Fall Enrollment for Public Higher Education 228 872 4 943 228 930 5 111 141 444 140 571 224 887 5 115 221 110 5 001 219 016 4 942 136 569 136 129 215 170 4 302 200 000 150 000 139 269 139 122 Specialized (Law and Health Sciences) 4 -Year 100 000 Other 2 -Yr 6 340 5 822 6 044 5 692 5 695 5 746 LCTCS 50 000 76 145 77 426 74 459 73 848 72 250 66 000 2010 -11 2011 -12 2012 -13 2013 -14 2014 -15 2015 -16 0 Source: Statewide Student Profile System - Data Submitted by institutions 19

Louisiana Higher Education Enrollment Trends

Louisiana Public Higher Education Enrollment by System Fall 2014 Enrollment Fall 2015 Enrollment Louisiana State University System 44, 646 45, 626 University of Louisiana System 89, 379 90, 483 Southern University System 12, 741 13, 061 Louisiana Community and Technical College System 72, 250 66, 000 Total 219, 016 215, 170 Source: Statewide Student Profile System - Data Submitted by institutions 21

Undergraduate Enrollment by Age Group 225, 000 203, 848 204, 604 200, 000 175, 000 55, 520 56, 135 201, 077 198, 162 196, 003 191, 627 52, 718 50, 659 48, 938 44, 990 150, 000 125, 000 25 and Over 24 and Under 100, 000 75, 000 148, 328 148, 469 148, 359 147, 503 147, 065 147, 637 2010 -11 2011 -12 2012 -13 2013 -14 Source: Statewide Student Profile System - Data Submitted by institutions 2014 -15 2015 -16 50, 000 25, 000 0

Higher Education & K-12 • The number of high school students enrolled in postsecondary courses has increased: Fall 2010 - 18, 551 Fall 2013 - 20, 454 Fall 2014 – 22, 875 Source: Board of Regents

Educating Our Own… 89% of all Louisiana students enrolled in college attend locally. Source: Board of Regents Louisiana students are more likely to attend college close to home!

Graduating Our Own… Program Completers That Lead to 4 & 5 Star Rated Jobs (Academic Year 2014 -15 ) Discipline Category Associate Degree or Below Baccalaureate or above Completers from Louisiana Science, Technology, Engineering, and Math (STEM) 2, 193 4, 661 79% Health 2, 346 3, 798 90% 978 4, 427 84% 2, 570 1, 159 93% 2 2, 707 90% 2, 498 85% 189 1, 483 85% 8, 278 20, 733 86% Business and Communication Trades Education Social and Behavioral Sciences and Human Services Arts and Humanities Grand Total Source: Board of Regents Completer System, Louisiana Workforce Commission and Louisiana Economic Development Star Rating System ntists e D e h t 75% of raduated in LA g U. from LS e doc's h t f o 70% d their e t e l p om have c (residency g trainin medical and/or t LSU. )a school

Louisiana Public Higher Education Efficiencies

What is Higher Ed doing to be more efficient? Louisiana higher education has reduced nearly 5, 000 full time employees (FTE) since FY 09 35 000 31 749 30 752 29 650 25 000 29 054 28 400 27 509 27 089 26 779 15 000 FY 09 FY 10 FY 11 FY 12 FY 13 FY 14 FY 15 FY 16 5, 000 fewer employees • 1, 197 fewer faculty members • 621 fewer administrators • 3, 153 fewer staff members Eliminated/Consolidated 582 Academic Programs (Jan/2008 and Dec/2015 ) Increased Online Courses & Degrees by 44% Source: Board of Regents

Louisiana Higher Education E�ciency Among Nation’s Best Louisiana Ranks 16 th Nationally in Efficiencies according to the US Chamber of Commerce Louisiana Ranks 4 th of 16 SREB States in Efficiencies Source: US Chamber of Commerce

Louisiana Colleges and Universities Fuel Research and Innovation Source: PAR Publication 335: Innovation in Louisiana

Transfer/Articulation Opportunities There were 3, 665 Louisiana Transfer majors in Fall/2014, a 20% increase (+606) over the number of majors in Fall/2013. Louisiana Transfer Degree Majors & Graduates, 2014 - 15 Source: Board of Regents Fact Book 2013 -14

Where are We Now… 48 th… th 49 … th 50 …

Louisiana Ranks 48 th Nationally In Educational Attainment Percentage Of Adults With Associate’s Or Bachelor’s Degrees 45% – 49. 1% 40% – 44. 9% 35% – 39. 9% 28. 4% Source: US Census Bureau 30% – 34. 9% 25% – 29. 9%

th 49 Louisiana Ranks in Total Education Revenue Per FTE Slipping from 48 th in 2014 Florida $-3, 447 $-2, 462 Louisiana $-2, 124 Montana $-2, 076 Nevada $-2, 037 California $-1, 824 LA gets $2, 462 less per student in state appropriations and tuition when compared nationally. Utah Connecticut Illinois Michigan Delaware Alaska Wyoming $3, 260 $3, 508 $3, 604 $5, 626 $6, 386 $7, 387 Figures in dollars Source: SHEEO State Higher Education Finance FY 2015

Louisiana Ranks 50 th… in Public Higher Education Appropriations Per FTE when compared Nationally For FY 2015, Louisiana has seen the largest percent decline in educational dollars from the state at -28. 5 percent. Source: 2015 SHEEO Report Percent Change: 2010 -2015

Our Plan…

The Future of Louisiana Higher Education

ELEVATE LOUISIANA: The New Reality for Higher Education Aligned to the Elevate Louisiana mission, the Board of Regents approved a series of initiatives which address the projected fiscal realities for Louisiana higher education. The initiatives are guided by the following principles: • Access to undergraduate education is essential to the population and economy of Louisiana. • Access to graduate education must be re-evaluated from a narrower state-wide perspective. • Resources must be provided for essential cuttingedge research at selected sites. • Postsecondary resources must be targeted to respond to local/regional workforce needs.

ELEVATE LOUISIANA: The New Reality for Higher Education The Board of Regents will utilize a framework designed around the following initiatives: 1. Approve, as appropriate, revisions to existing role, scope and mission statements. 2. Develop and Adopt a Policy on mergers/consolidations of institutions. 3. Develop and Adopt a Policy on Financial Early Warning Systems and Financial Stress. 4. Revise Regents’ Policy on Low-Completer Review to Elevate the Threshold for Review. 5. Conduct a Statewide and Regional Review of all Graduate programs. 6. Conduct a Statewide and Regional Review of Targeted Undergraduate Programs. 7. Review Degree Program Requirements and Available Courses to Encourage/Reward Structured Pathways to Degrees with Limited Course Choice.

The Path Forward… Our Focus… ELEVATE LOUISIANA Increase Educational Attainment Ensure Affordability Maximize Accountability Our Priorities… Significant and Sustainable State Funding Increase Need-based Student Aid Invest in State Capital Outlay DISINVESTMENT/ BUDGET CUTS

Louisiana Board of Regents Commissioner Joseph C. Rallo www. regents. la. gov Facebook: Louisiana Board of Regents Twitter: @LA_Regents
- Slides: 40