UPDATE Graphs of Quadratic Functions Part 1 Graph


")


- Slides: 18
UPDATE!!! Graphs of Quadratic Functions Part 1
Graph Quadratic Functions: Standard Form: y = 2 ax + bx + c Shape: Parabola When in standard form, If a is positive, the parabola opens up y = ax 2+bx+c If a is negative, the parabola opens down y = -ax 2+bx+c
Will It Open Up or Down? • y = 4 x 2 + 7 x – 4 • Up • y = -6. 5 x 2 + 9 • Down • -2 x 2 + y = 8 x + 1 y = 2 x 2 +8 x + 1 y=- *must be in standard form • Down • y + ½x 2 = -3 x ½x 2 - • Up 3 x *must be in standard form
Parts of Parabolas: Vertex: • Highest or lowest point of the graph (the max or min of the function) • Lies on the axis of symmetry Axis of Symmetry: Axis of Line of symmetry that Symmetry divides parabola into two parts that are mirror image of each other. Vertex
The axis of symmetry is the vertical line passing through y = ax 2+bx+c Find Vertex and Write the equation of the axis of symmetry for y = 3 x 2+8 x-6 1 st: Identify a, b, and c 2 nd: Plug into a=3, b=8, c=-6 Axis of symmetry is vertical line x= -4 3
Find the vertex of y = 3 x 2+8 x-6 Continued… 3 rd: Plug x value into function to solve for y
Find the Vertex and Graph: y = x 2 First find the vertex. y = ax 2+bx+c a=1, b=0, and c=0 x=0 is the axis of symmetry This is also the x value of the vertex, now find the y value. If x = 0, y = (0)2 Vertex = (0, 0)
Example: y = x 2 Make a table for y = 2 Once x you find the vertex, pick at least 2 more points to see how to graph the parabola, plot them and their mirror images to make it symmetrical Since the vertex is (0, 0), pick an + and a - x value
Graphing Quadratic Functions UPDATE!!! 5 Simple Steps (make sure to identify the a, b, and c values) • Find the equation of the axis of symmetry • & draw it on the graph 1. Find the vertex coordinates & plot vertex on graph 2. Find and plot the y-intercept point 3. Find and plot another point on the other
Graph Points Line of symmetry A is positive 1, so the parabola opens up with (0, 0) as the low point.
GRAPH: y = 2 x -x-6 • Identify the a, b, and c values • First find the vertex • Make a table with an x value to the right and left of the vertex x value • Graph these points and connect. • Label the vertex
Find vertex and plug in to find y. value to have high or low point. 1.
The x value of the vertex is 1/2 • Now find the y value of the vertex by plugging x back into the equation. y = x 2 -x-6 • y = (1/2)2 – ½ - 6 • The y value is -25/4. • Now pick a point to the left and right of ½.
GRAPH: y = 2 x -x-6 I try to pick points equal distance from the vertex x value. I also tried 0 here.
Y=x 2 -x-6 Vertex low line of symmetry x = opens up (a positive)
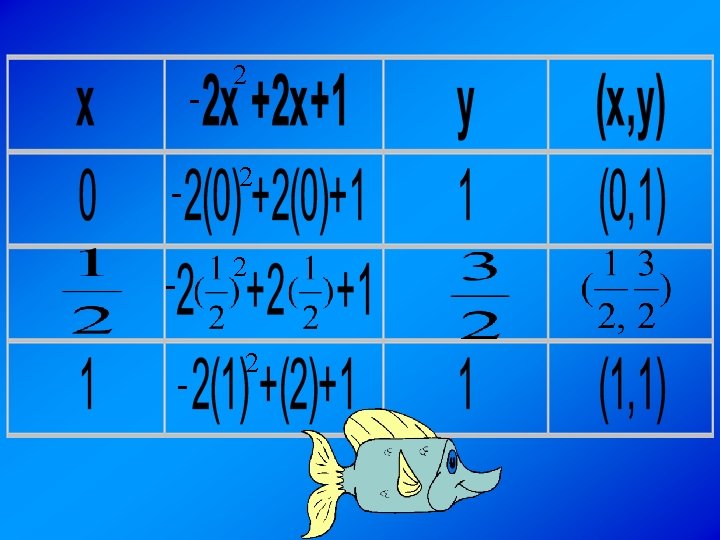
Graph: y= 2 -2 x +2 x+1 a is negativeopens down Line of Symmetry Find the y value, then pick a point to the left and right of 1/2 to see how to draw the parabola. =1 2
2 y=-2 x +2 x+1