Unsupervised Learning Clustering Some material adapted from slides

 to learn a")


 • Randomly choose k cluster center")
 • Randomly choose k cluster center")
 • Randomly choose k cluster center")
 • Randomly choose k cluster center")

 • Very sensitive")


")

 are the")

- Slides: 30
Unsupervised Learning: Clustering Some material adapted from slides by Andrew Moore, CMU. See http: //www. autonlab. org/tutorials/ for a repository of Data Mining tutorials
Unsupervised Learning • Supervised learning used labeled data pairs (x, y) to learn a function f : X→Y. • But, what if we don’t have labels? • No labels = unsupervised learning • Only some points are labeled = semi-supervised learning – Getting labels may be expensive, so we only get a few • Clustering is the unsupervised grouping of data points. It can be used for knowledge discovery
Clustering algorithms • There are many clustering algorithms • Clustering is typically done using a distance measure defined between instances • The distance is defined in the instance feature space • Agglomerative approach works bottom up: – Treat each instance as a cluster – Merge the two closest clusters – Repeat until the stop condition is met • Top-down approach starts a cluster with all instances – Find a cluster to split into two or more smaller clusters – Repeat until stop condition met
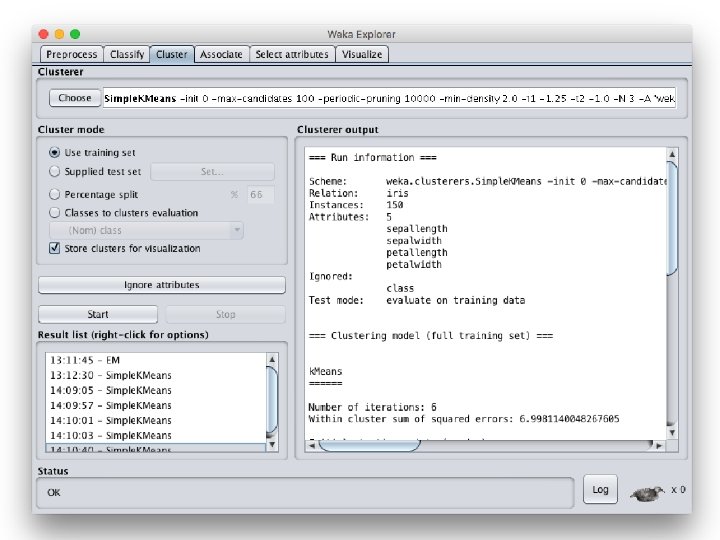
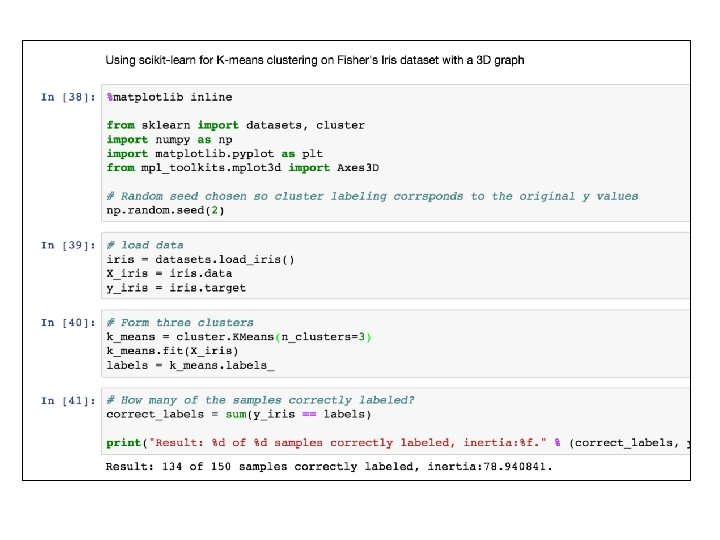
Clustering Data
K-Means Clustering K-Means ( k , data ) • Randomly choose k cluster center locations (centroids) • Loop until convergence • Assign each point to the cluster of the closest centroid • Re-estimate the cluster centroids based on the data assigned to each • Convergence: no point is assigned to a different cluster
K-Means Clustering K-Means ( k , data ) • Randomly choose k cluster center locations (centroids) • Loop until convergence • Assign each point to the cluster of the closest centroid. • Re-estimate the cluster centroids based on the data assigned to each • Convergence: no point is assigned to a different cluster
K-Means Clustering K-Means ( k , data ) • Randomly choose k cluster center locations (centroids) • Loop until convergence • Assign each point to the cluster of the closest centroid • Re-estimate the cluster centroids based on the data assigned to each • Convergence: no point is assigned to a different cluster
K-Means Clustering K-Means ( k , data ) • Randomly choose k cluster center locations (centroids) • Loop until convergence • Assign each point to the cluster of the closest centroid • Re-estimate the cluster centroids based on the data assigned to each • Convergence: no point is assigned to a different cluster
11
Problems with K-Means • Only works for numeric data (typical reals) • Very sensitive to the initial points – Do many runs of k-Means, each with different initial centroids – Seed the centroids using a better method than random. (e. g. , Farthest-first sampling) • Must manually choose k – Learn the optimal k for the clustering. (Note that this requires a performance measure)
Problems with K-Means • How do you tell it which clustering you want? – Constrained clustering techniques Same-cluster constraint (must-link) Different-cluster constraint (cannot-link)
Hierarchical Clustering Recursive partitioning/merging of a data set 1 -clustering 5 2 -clustering 1 3 -clustering 4 2 4 -clustering 3 5 -clustering 1 2 3 4 5
Dendogram • Represents all partitionings of the data • We can get a K clustering by looking at the connected components at any given level • Frequently binary dendograms, but n-ary dendograms are easy to obtain with minor changes to algorithms
Advantages of hierarchical clustering • Don’t need to specify the number of clusters • Good for data visualization – See how the data points interact at many levels – Can view the data at multiple levels of granularity – Understand how all points interact • Specifies all of the K clusterings/partitions
Hierarchical Clustering • Common in many domains – Biologists and social scientists – Gene expression data – Document/web page organization • DMOZ • Yahoo directories Two main approaches… animal vertebrate fish reptile amphib. mammal invertebrate worm insect crustacean
Divisive hierarchical clustering • Top-down • Finding the best partitioning of the data is generally exponential in time • Common approach: – Let C be a set of clusters – Initialize C to be the one-clustering of the data – While there exists a cluster c in C • remove c from C • partition c into 2 clusters using a flat clustering algorithm, c 1 and c 2 • Add to c 1 and c 2 C • Bisecting k-means
Divisive clustering
Divisive clustering start with one cluster
Divisive clustering split using flat clustering, e. g. Kmeans
Divisive clustering
Divisive clustering split using flat clustering
Divisive clustering split using flat clustering
Divisive clustering
Hierarchical Agglomerative Clustering • Let C be a set of clusters • Initialize C to all points/docs as separate clusters • While C contains more than one cluster – find c 1 and c 2 in C that are closest together – remove c 1 and c 2 from C – merge c 1 and c 2 and add resulting cluster to C • History of merging forms a binary tree or hierarchy • Q: How to measure distance between clusters?
Distance between clusters Single-link – Similarity of the most similar (single-link)
Distance between clusters Complete-link – Similarity of the “furthest” points, the least similar Why are these “local” methods used? efficiency
Distance between clusters • Centroid – Clusters whose centroids (centers of gravity) are the most similar
Distance between clusters • Average-link – Average similarity between all pairs of elements