
UNLVUNMANNED AERIAL VEHICLE UAV THINFILM SOLAR CELL INITIATIVE






- Slides: 52
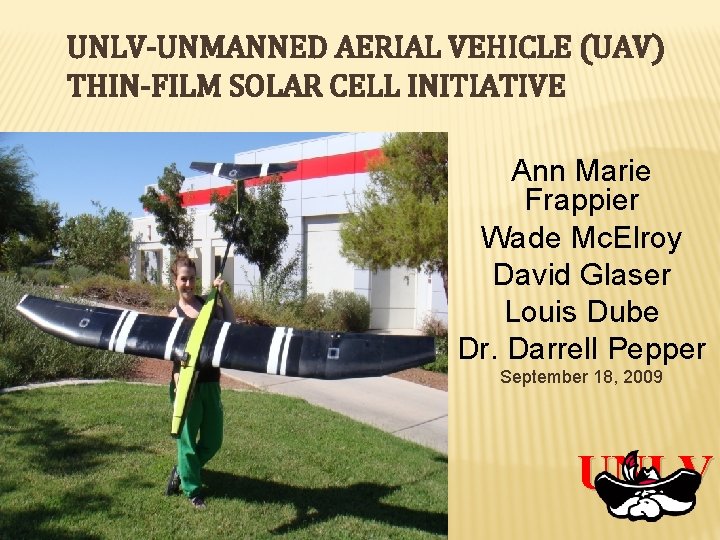
UNLV-UNMANNED AERIAL VEHICLE (UAV) THIN-FILM SOLAR CELL INITIATIVE Ann Marie Frappier Wade Mc. Elroy David Glaser Louis Dube Dr. Darrell Pepper September 18, 2009 UNLV
PRESENTATION OVERVIEW 1. 2. 3. 4. 5. 6. Project Review Final Design Airframe Optimization Component Selection Construction Questions?
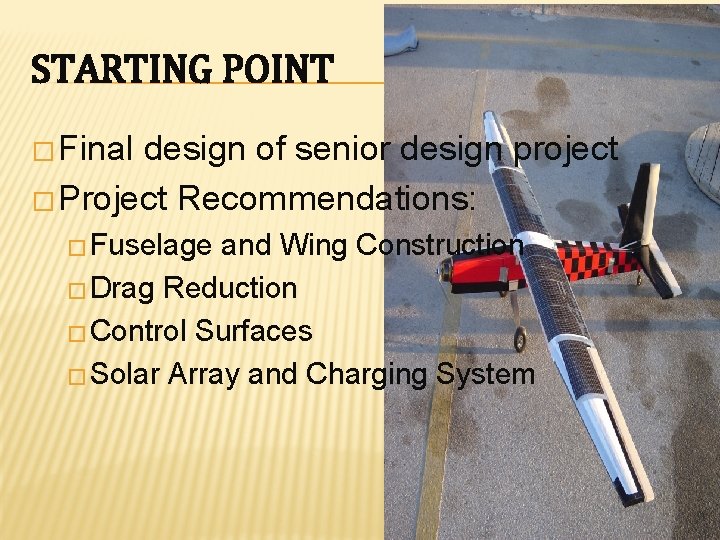
STARTING POINT � Final design of senior design project � Project Recommendations: � Fuselage and Wing Construction � Drag Reduction � Control Surfaces � Solar Array and Charging System
THIN-FILM SOLAR CELLS � In many cases, uses less than 1% of the raw material as compared to wafer-based solar cells, resulting in significant price drop per watt � So far, less efficient than wafer solar cells � Printability � Easily conforms to wing or fuselage surfaces � Requires minimum maintenance
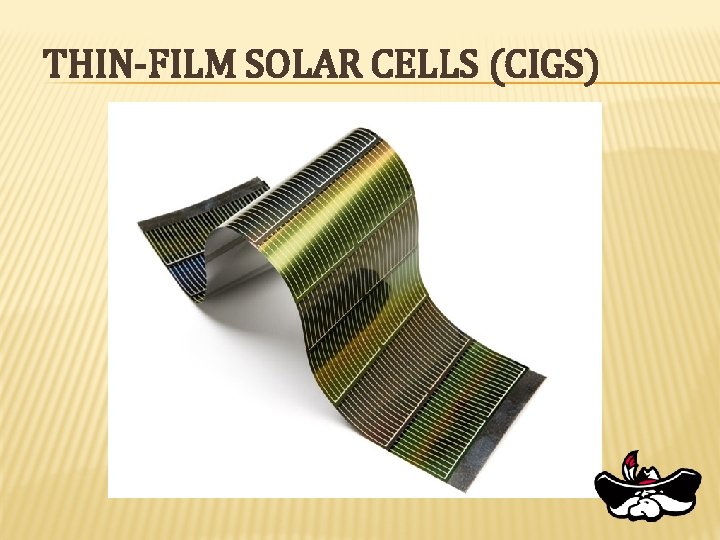
THIN-FILM SOLAR CELLS (CIGS)
THIN-FILM SOLAR CELLS � � Amorphous silicon � The most common type of thin film cells, they are not printable. CIS � This is a printable thin-film that attempts to drive down the cost by using copper, indium, and selenium instead of silicon. CIGS � This is also printable and is very similar to CIS cells, the most important difference being gallium is used to replace as much of the expensive indium as possible. CSG � Silicon offshoot that shows promise; gives up some flexibility for efficiency.
MISSION ANALYSIS
REFINED MISSION REQUIREMENTS � Refined mission requirements point to a maximum ceiling of 10, 000 ft AGL for energy height. � Ability to run racetrack pattern over target for surveillance is paramount. � 25° bank angle, sustained turn was chosen as appropriate for this application. � The airframe must also sustain turning attitude to ride thermals.
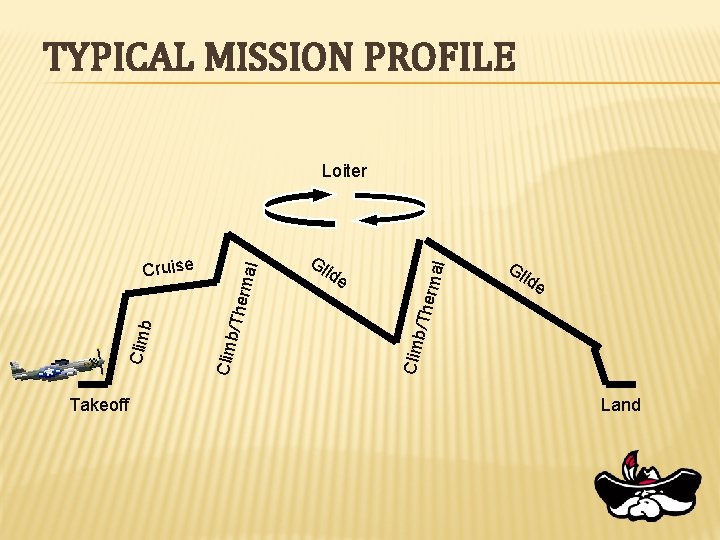
TYPICAL MISSION PROFILE Takeoff l ide b/Th erma Gl Gl id e Clim erma b/Th Clim b Cruise l Loiter Land
FINAL DESIGN
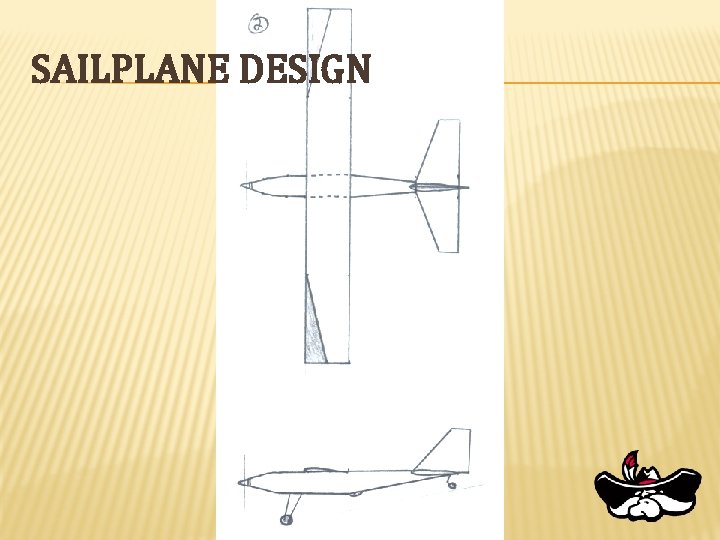
SAILPLANE DESIGN
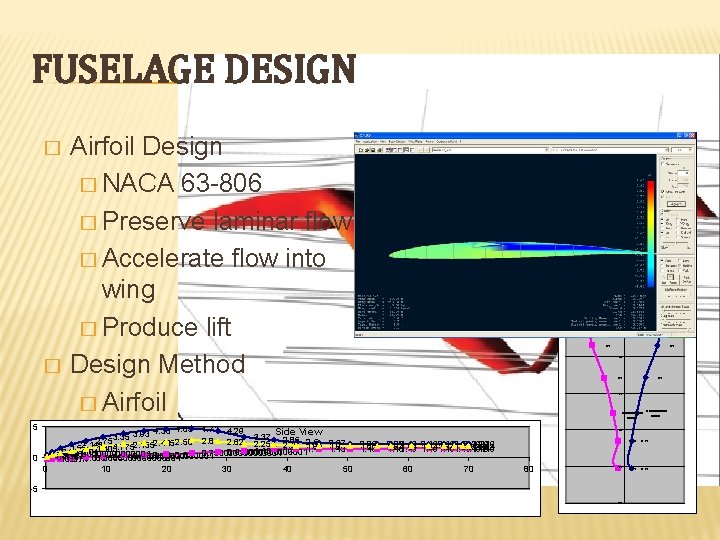
FUSELAGE DESIGN � � 5 Airfoil Design � NACA 63 -806 � Preserve laminar flow � Accelerate flow into wing � Produce lift Design Method � Airfoil � Taper after wing 4. 35 4. 63 4. 71 4. 29 Side View 3. 37 3. 35 3. 93 2. 75 2. 62 2. 25 2. 85 2. 58 2. 5 2. 37 2. 415 2. 26 2. 155 2. 145 2. 1 1. 95 1. 9 1. 86 1. 775 1. 53 1. 46 1. 13 1. 35 1. 43 1. 041. 405 0. 950000001 0. 93 0. 750000001 0. 680000001 0. 53 0. 48 0. 4 0. 380000001 0. 36 0. 2 0. 115 0. 0600000001 0 -0. 065 -0. 17 -0. 21 0 10 20 30 40 50 0 -3 -2 -0. 285 0 1 -0. 57 -1 0. 8500000001 -1. 105 -5 3 1. 105 -1. 345 -1. 575 2 0. 8500000001 1. 345 1. 575 -10 -1. 775 -15 -1. 935 -2. 035 1. 935 2. 035 -20 -1. 95 -25 -1. 65 -30 -1. 05 -35 0. 6000000001 -40 2. 22 2. 19 1. 841. 84 1. 49 2. 192. 19 1. 491. 49 1. 461. 84 60 70 80 -45 -5 -50 -0. 35
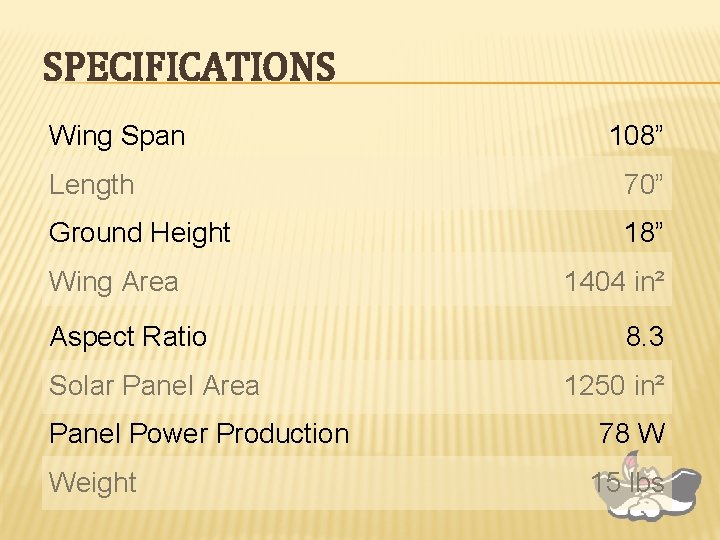
SPECIFICATIONS Wing Span 108” Length 70” Ground Height 18” Wing Area Aspect Ratio Solar Panel Area Panel Power Production Weight 1404 in² 8. 3 1250 in² 78 W 15 lbs
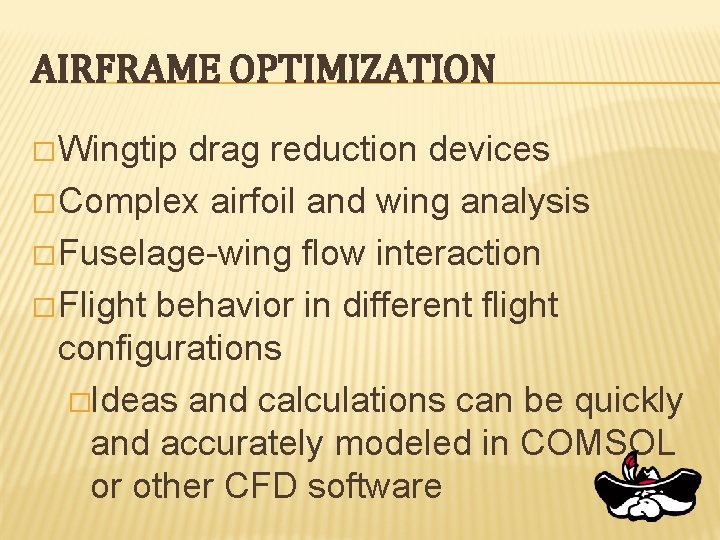
AIRFRAME OPTIMIZATION � Wingtip drag reduction devices � Complex airfoil and wing analysis � Fuselage-wing flow interaction � Flight behavior in different flight configurations �Ideas and calculations can be quickly and accurately modeled in COMSOL or other CFD software
WINGTIP DEVICES
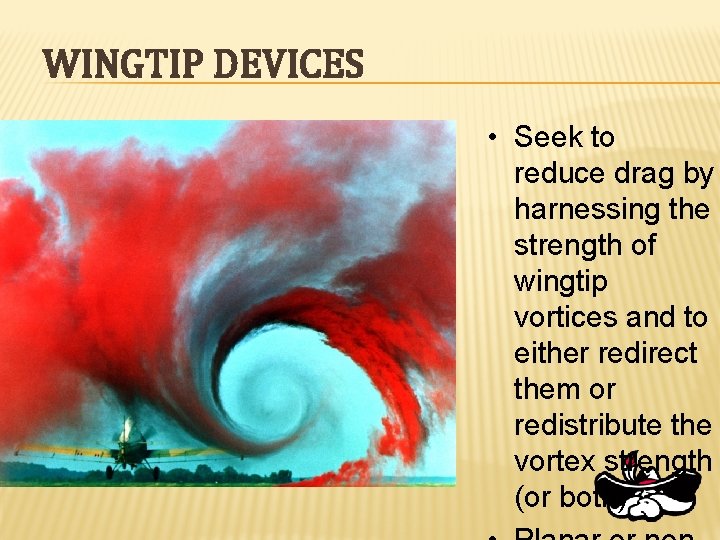
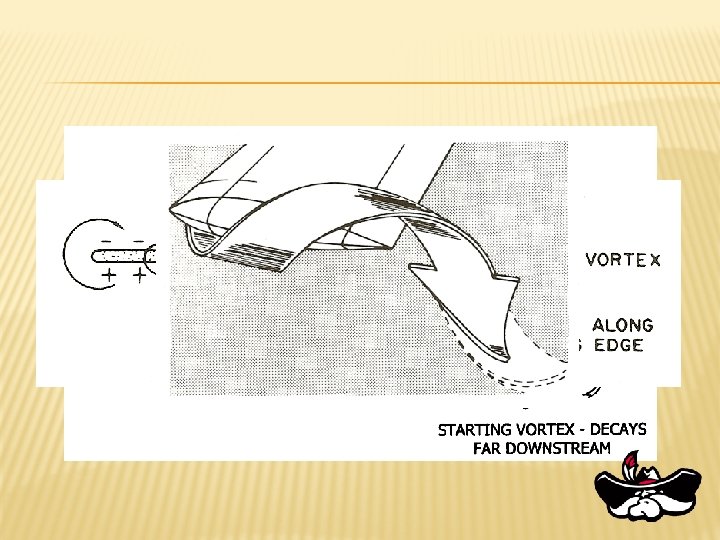
WINGTIP DEVICES • Seek to reduce drag by harnessing the strength of wingtip vortices and to either redirect them or redistribute the vortex strength (or both)
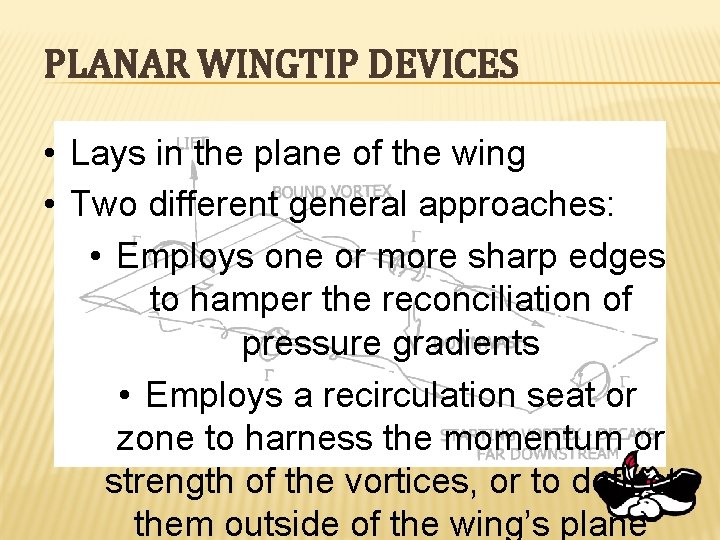
PLANAR WINGTIP DEVICES • Lays in the plane of the wing • Two different general approaches: • Employs one or more sharp edges to hamper the reconciliation of pressure gradients • Employs a recirculation seat or zone to harness the momentum or strength of the vortices, or to deflect them outside of the wing’s plane
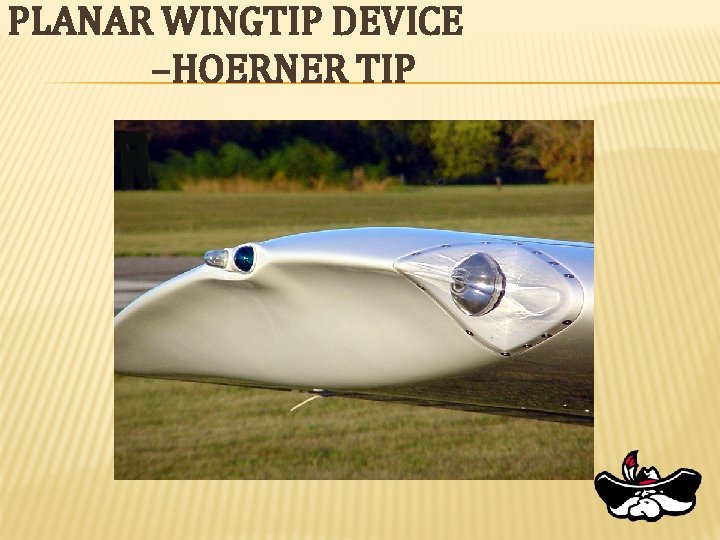
PLANAR WINGTIP DEVICE –HOERNER TIP
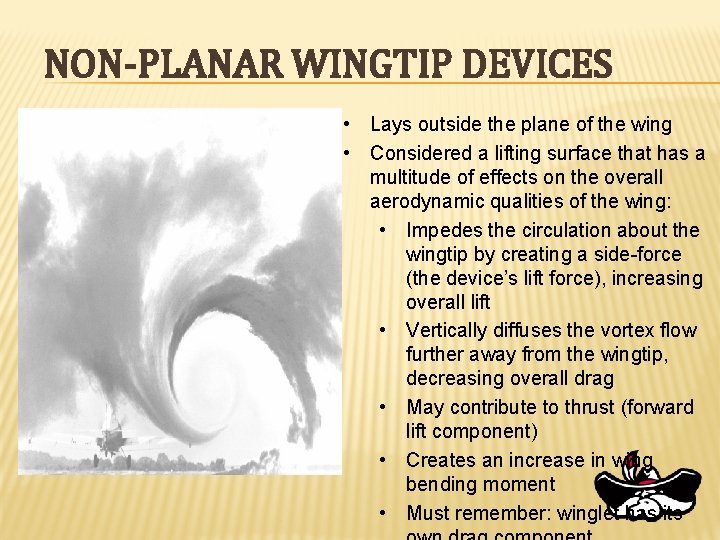
NON-PLANAR WINGTIP DEVICES • Lays outside the plane of the wing • Considered a lifting surface that has a multitude of effects on the overall aerodynamic qualities of the wing: • Impedes the circulation about the wingtip by creating a side-force (the device’s lift force), increasing overall lift • Vertically diffuses the vortex flow further away from the wingtip, decreasing overall drag • May contribute to thrust (forward lift component) • Creates an increase in wing bending moment • Must remember: winglet has its
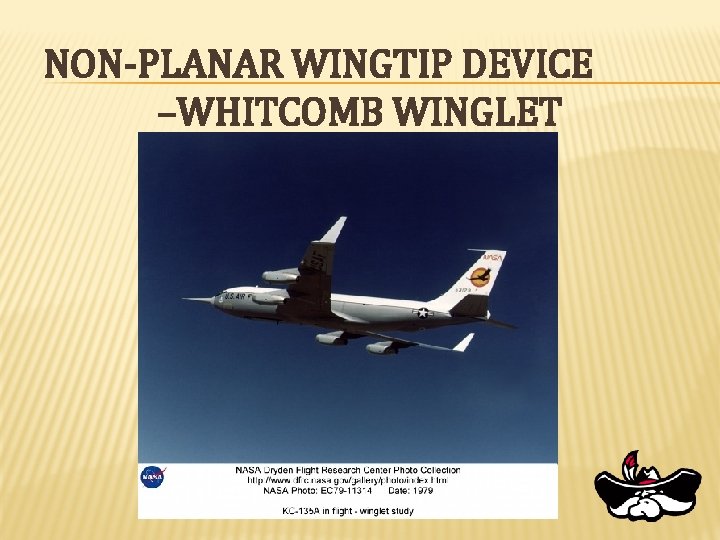
NON-PLANAR WINGTIP DEVICE –WHITCOMB WINGLET
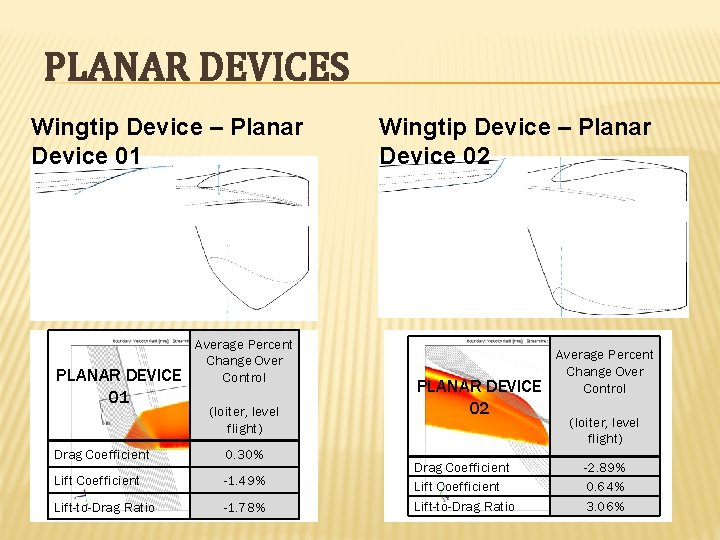
PLANAR DEVICES Wingtip Device – Planar Device 01 PLANAR DEVICE 01 Average Percent Change Over Control (loiter, level flight) Drag Coefficient 0. 30% Lift Coefficient -1. 49% Lift-to-Drag Ratio -1. 78% Wingtip Device – Planar Device 02 PLANAR DEVICE 02 Drag Coefficient Lift-to-Drag Ratio Average Percent Change Over Control (loiter, level flight) -2. 89% 0. 64% 3. 06%
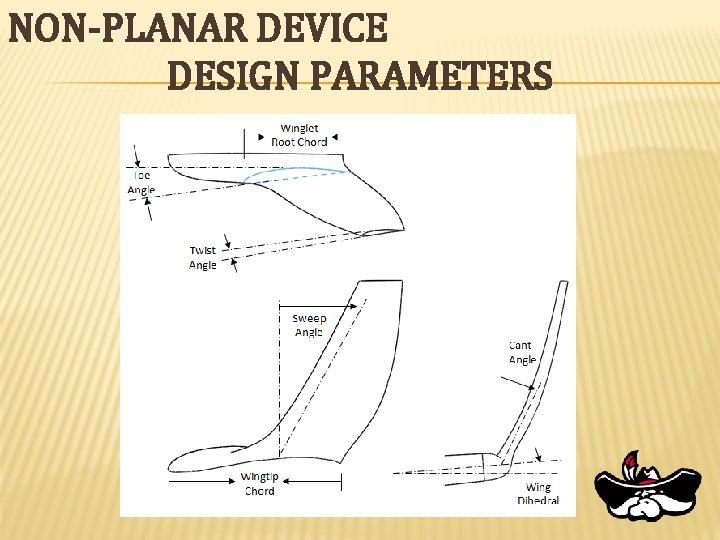
NON-PLANAR DEVICE DESIGN PARAMETERS
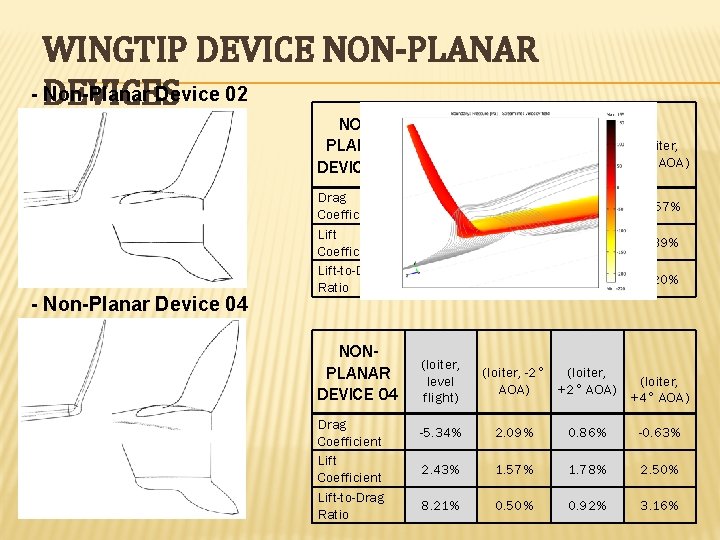
WINGTIP DEVICE NON-PLANAR - DEVICES Non-Planar Device 02 NONPLANAR DEVICE 02 - Non-Planar Device 04 Drag Coefficient Lift-to-Drag Ratio NONPLANAR DEVICE 04 Drag Coefficient Lift-to-Drag Ratio (loiter, level flight) (loiter, -2° (loiter, AOA) +2° AOA) (loiter, +4° AOA) -6. 46% -4. 82% -3. 51% -3. 57% 2. 89% 0. 35% 2. 13% 2. 39% 10. 00% 5. 43% 5. 85% 6. 20% (loiter, level flight) (loiter, -2° (loiter, AOA) +2° AOA) (loiter, +4° AOA) -5. 34% 2. 09% 0. 86% -0. 63% 2. 43% 1. 57% 1. 78% 2. 50% 8. 21% 0. 50% 0. 92% 3. 16%
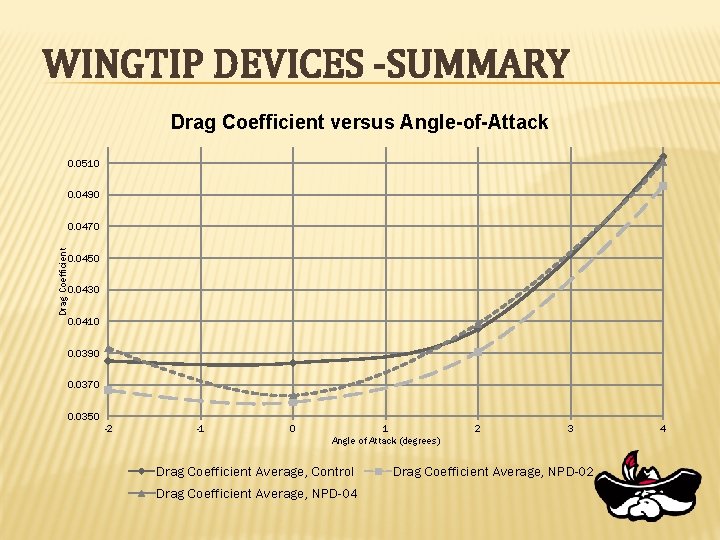
WINGTIP DEVICES -SUMMARY Drag Coefficient versus Angle-of-Attack 0. 0510 0. 0490 Drag Coefficient 0. 0470 0. 0450 0. 0430 0. 0410 0. 0390 0. 0370 0. 0350 -2 -1 0 1 Angle of Attack (degrees) Drag Coefficient Average, Control Drag Coefficient Average, NPD-04 2 3 Drag Coefficient Average, NPD-02 4
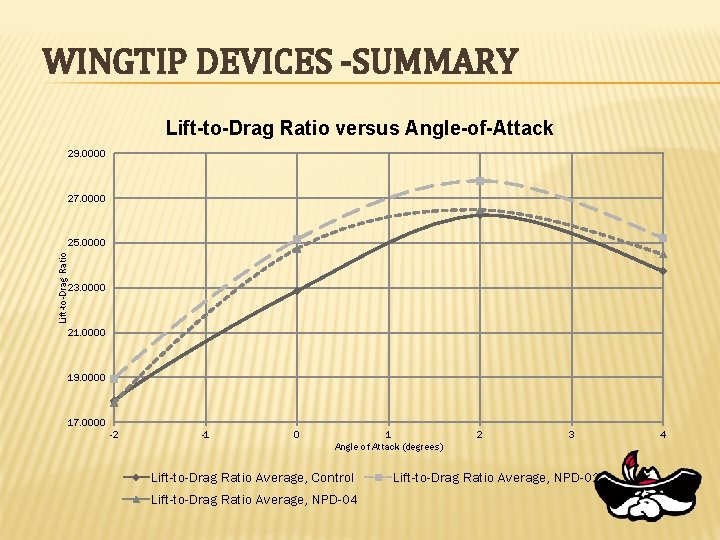
WINGTIP DEVICES -SUMMARY Lift-to-Drag Ratio versus Angle-of-Attack 29. 0000 27. 0000 Lift-to-Drag Ratio 25. 0000 23. 0000 21. 0000 19. 0000 17. 0000 -2 -1 0 1 Angle of Attack (degrees) Lift-to-Drag Ratio Average, Control Lift-to-Drag Ratio Average, NPD-04 2 3 Lift-to-Drag Ratio Average, NPD-02 4
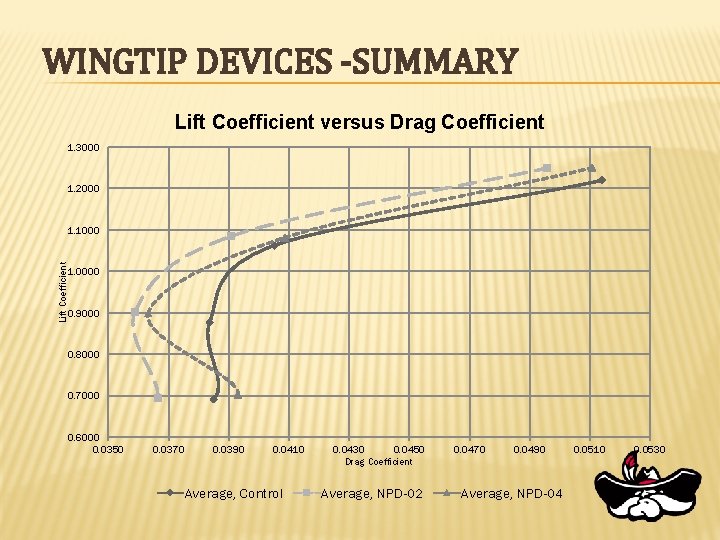
WINGTIP DEVICES -SUMMARY Lift Coefficient versus Drag Coefficient 1. 3000 1. 2000 Lift Coefficient 1. 1000 1. 0000 0. 9000 0. 8000 0. 7000 0. 6000 0. 0350 0. 0370 0. 0390 0. 0410 Average, Control 0. 0430 0. 0450 Drag Coefficient Average, NPD-02 0. 0470 0. 0490 Average, NPD-04 0. 0510 0. 0530
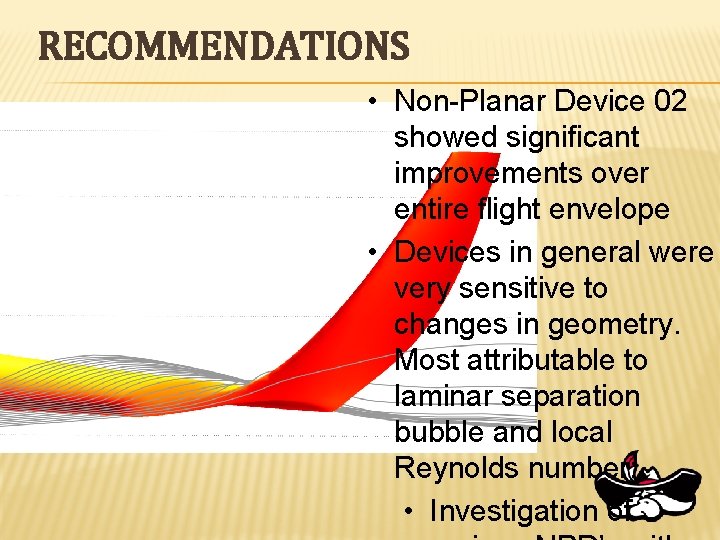
RECOMMENDATIONS • Non-Planar Device 02 showed significant improvements over entire flight envelope • Devices in general were very sensitive to changes in geometry. Most attributable to laminar separation bubble and local Reynolds number: • Investigation of
WING-FUSELAGE JUNCTIONS
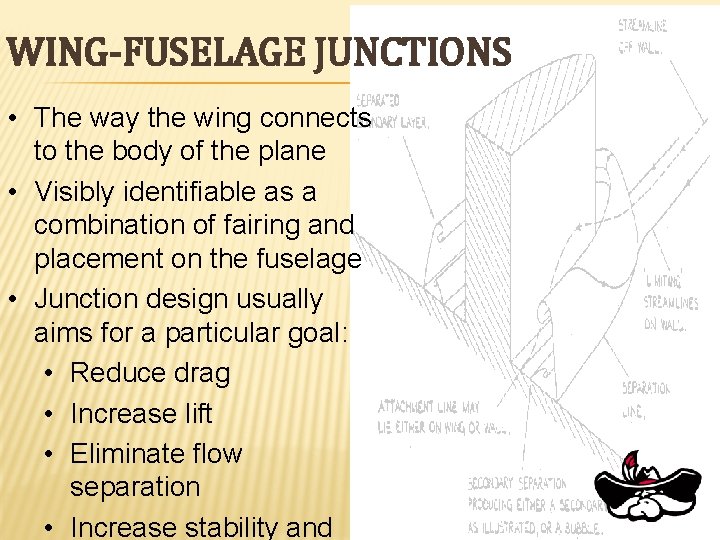
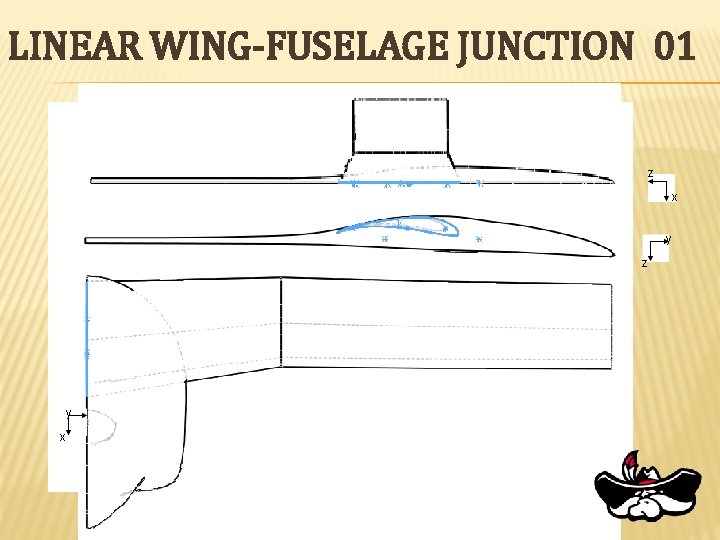
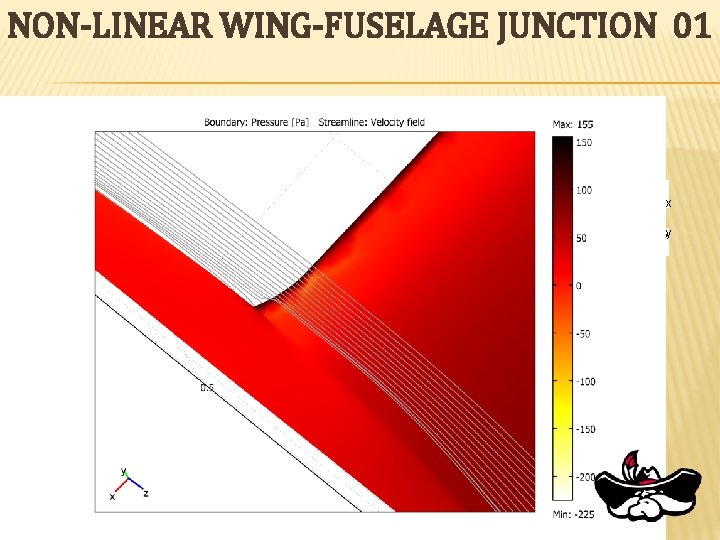
WING-FUSELAGE JUNCTIONS • The way the wing connects to the body of the plane • Visibly identifiable as a combination of fairing and placement on the fuselage • Junction design usually aims for a particular goal: • Reduce drag • Increase lift • Eliminate flow separation • Increase stability and
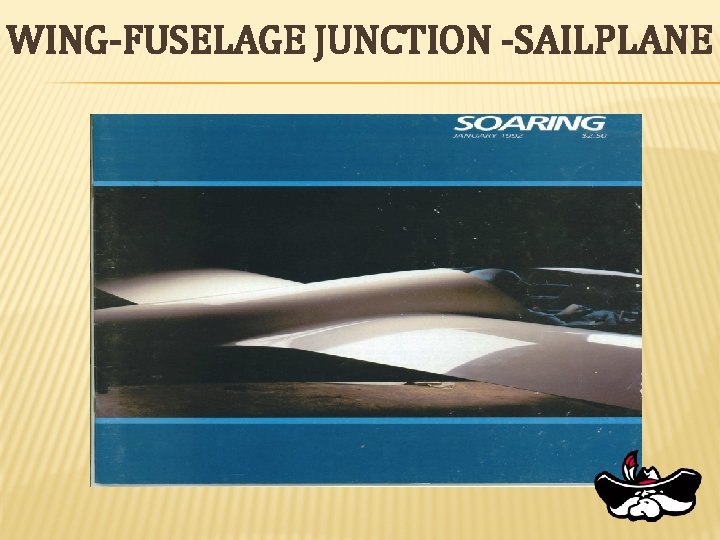
WING-FUSELAGE JUNCTION -SAILPLANE
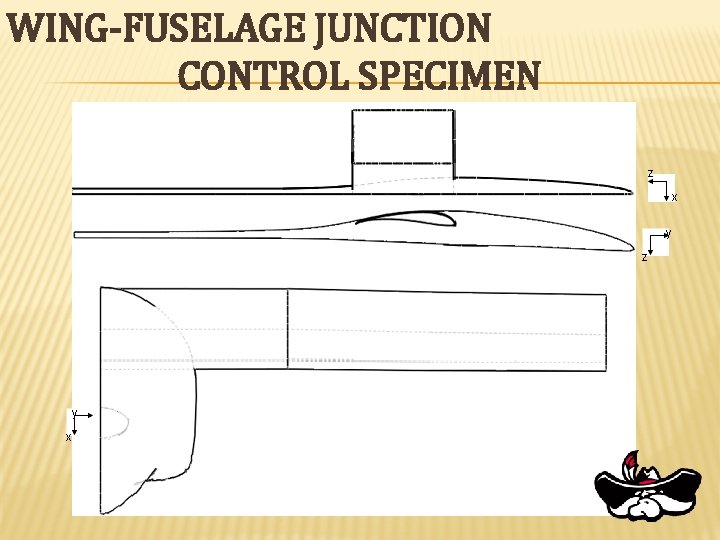
WING-FUSELAGE JUNCTION CONTROL SPECIMEN z x y z y x
LINEAR WING-FUSELAGE JUNCTION 01 z x y z y x
NON-LINEAR WING-FUSELAGE JUNCTION 01 z x y z y x
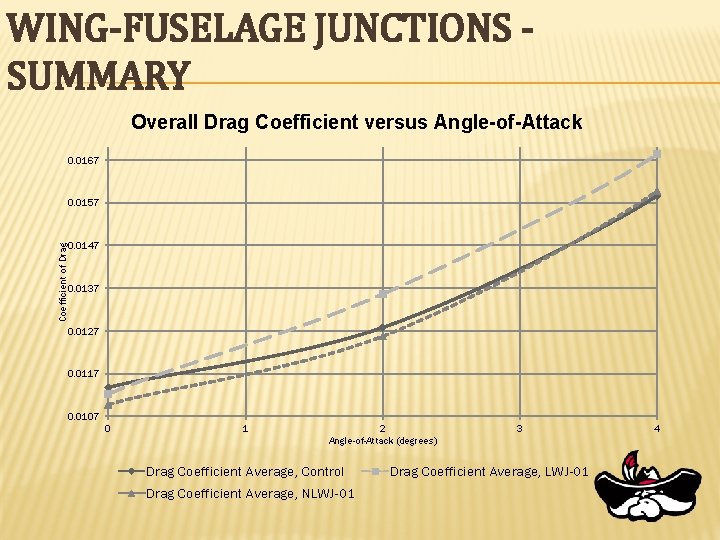
WING-FUSELAGE JUNCTIONS SUMMARY Overall Drag Coefficient versus Angle-of-Attack 0. 0167 Coefficient of Drag 0. 0157 0. 0147 0. 0137 0. 0127 0. 0117 0. 0107 0 1 2 Angle-of-Attack (degrees) Drag Coefficient Average, Control Drag Coefficient Average, NLWJ-01 3 Drag Coefficient Average, LWJ-01 4
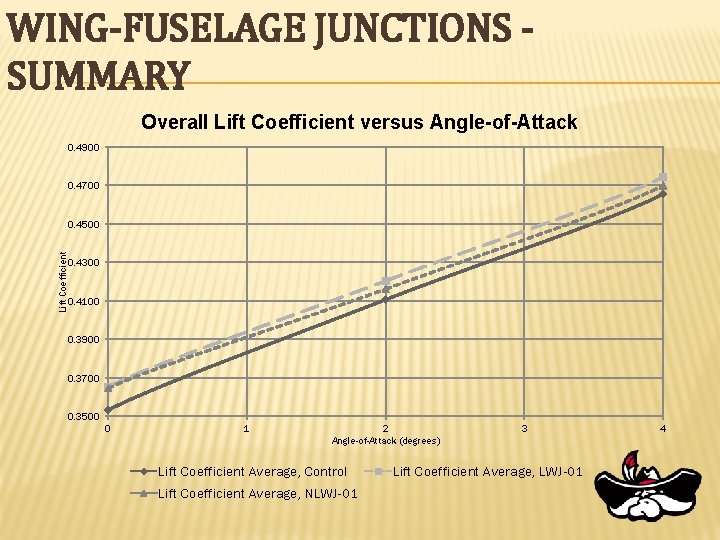
WING-FUSELAGE JUNCTIONS SUMMARY Overall Lift Coefficient versus Angle-of-Attack 0. 4900 0. 4700 Lift Coefficient 0. 4500 0. 4300 0. 4100 0. 3900 0. 3700 0. 3500 0 1 2 Angle-of-Attack (degrees) Lift Coefficient Average, Control Lift Coefficient Average, NLWJ-01 3 Lift Coefficient Average, LWJ-01 4
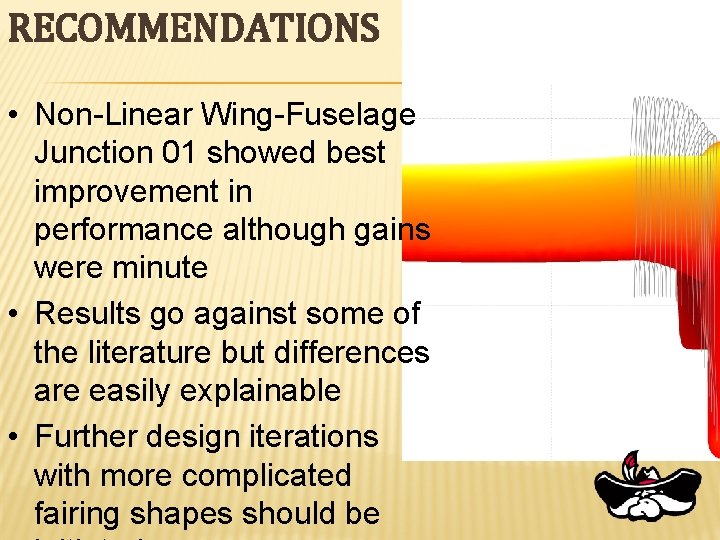
RECOMMENDATIONS • Non-Linear Wing-Fuselage Junction 01 showed best improvement in performance although gains were minute • Results go against some of the literature but differences are easily explainable • Further design iterations with more complicated fairing shapes should be
COMPONENT SELECTION
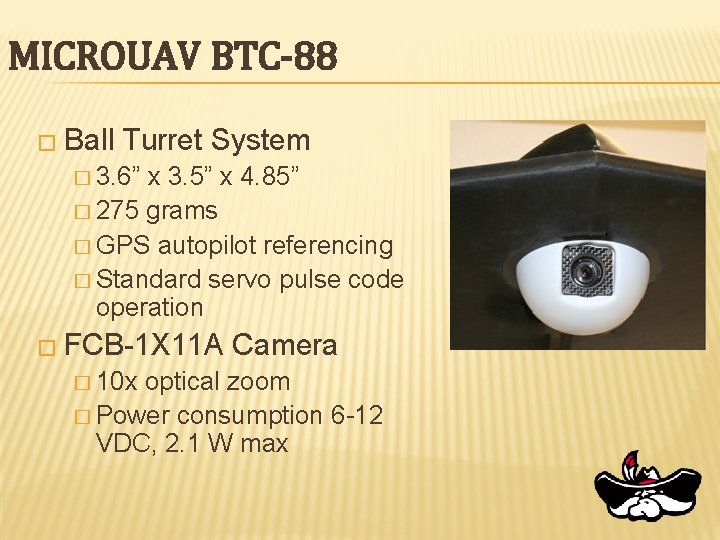
MICROUAV BTC-88 � Ball Turret System � 3. 6” x 3. 5” x 4. 85” � 275 grams � GPS autopilot referencing � Standard servo pulse code operation � FCB-1 X 11 A � 10 x Camera optical zoom � Power consumption 6 -12 VDC, 2. 1 W max
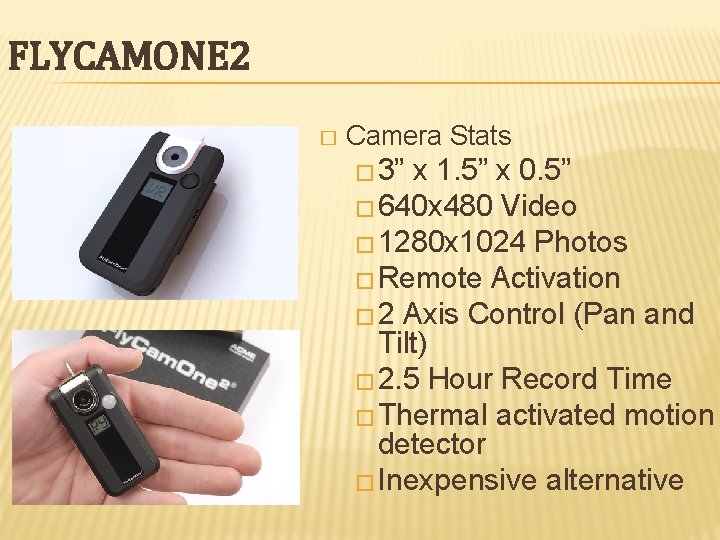
FLYCAMONE 2 � Camera Stats � 3” x 1. 5” x 0. 5” � 640 x 480 Video � 1280 x 1024 Photos � Remote Activation � 2 Axis Control (Pan and Tilt) � 2. 5 Hour Record Time � Thermal activated motion detector � Inexpensive alternative
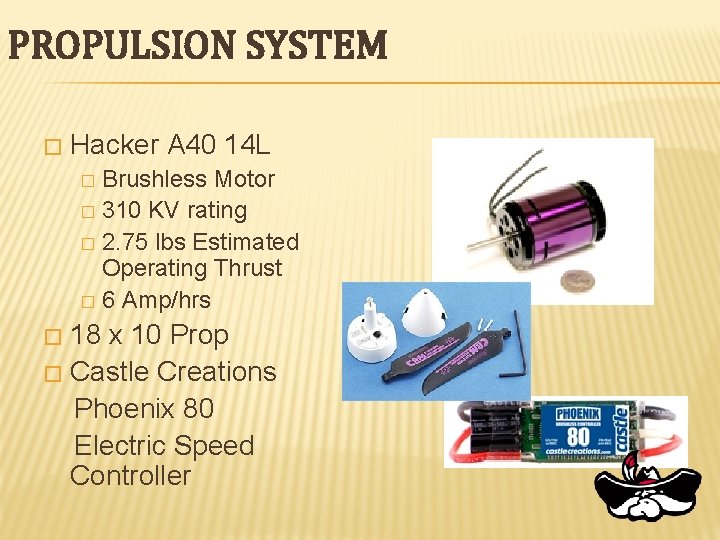
PROPULSION SYSTEM � Hacker A 40 14 L Brushless Motor � 310 KV rating � 2. 75 lbs Estimated Operating Thrust � 6 Amp/hrs � 18 x 10 Prop � Castle Creations Phoenix 80 Electric Speed Controller �
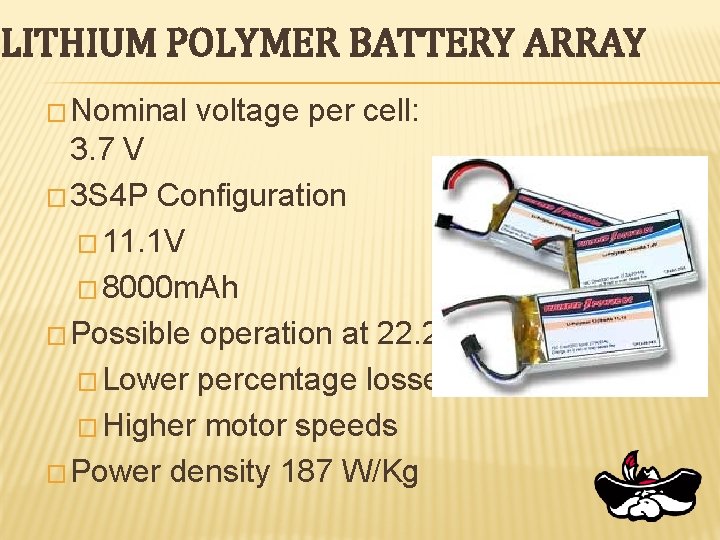
LITHIUM POLYMER BATTERY ARRAY � Nominal voltage per cell: 3. 7 V � 3 S 4 P Configuration � 11. 1 V � 8000 m. Ah � Possible operation at 22. 2 V � Lower percentage losses � Higher motor speeds � Power density 187 W/Kg
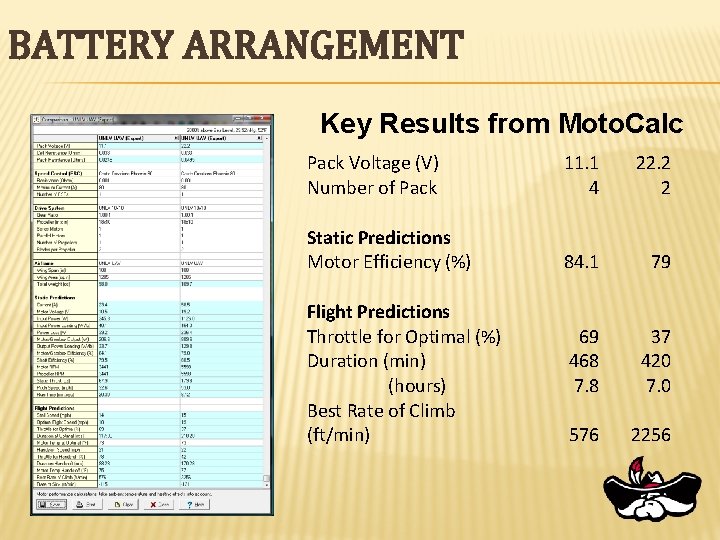
BATTERY ARRANGEMENT Key Results from Moto. Calc Pack Voltage (V) Number of Pack 11. 1 4 22. 2 2 Static Predictions Motor Efficiency (%) 84. 1 79 69 468 7. 8 37 420 7. 0 576 2256 Flight Predictions Throttle for Optimal (%) Duration (min) (hours) Best Rate of Climb (ft/min)
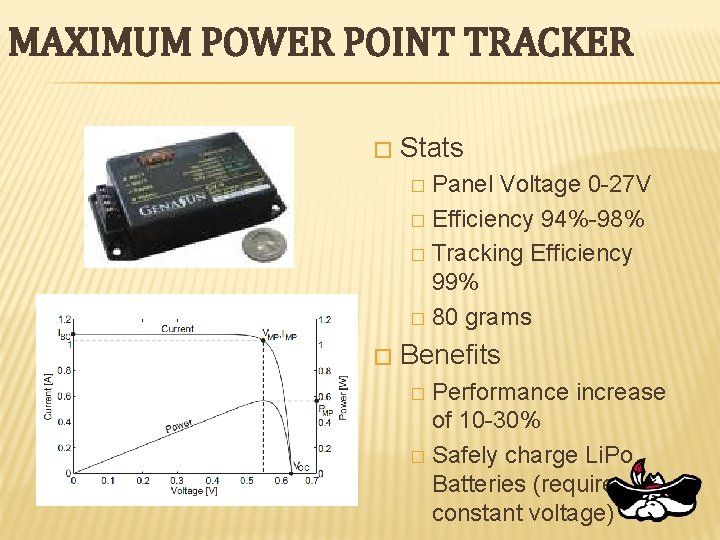
MAXIMUM POWER POINT TRACKER � Stats Panel Voltage 0 -27 V � Efficiency 94%-98% � Tracking Efficiency 99% � 80 grams � � Benefits Performance increase of 10 -30% � Safely charge Li. Po Batteries (require constant voltage) �
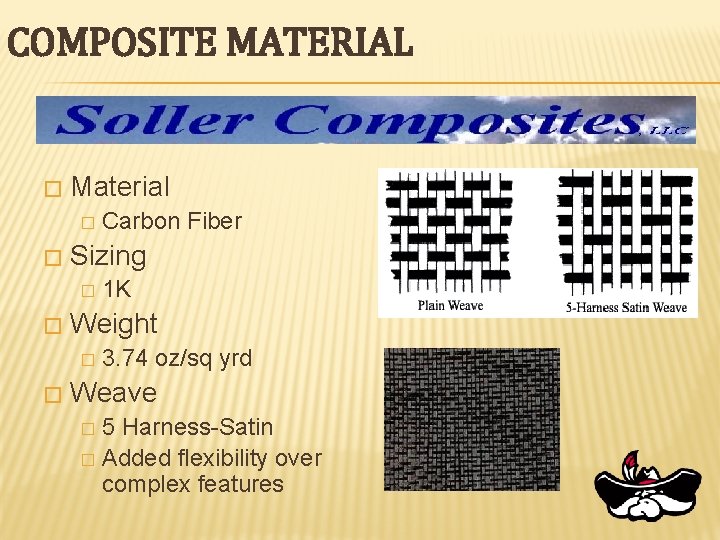
COMPOSITE MATERIAL � Material � � Sizing � � 1 K Weight � � Carbon Fiber 3. 74 oz/sq yrd Weave 5 Harness-Satin � Added flexibility over complex features �
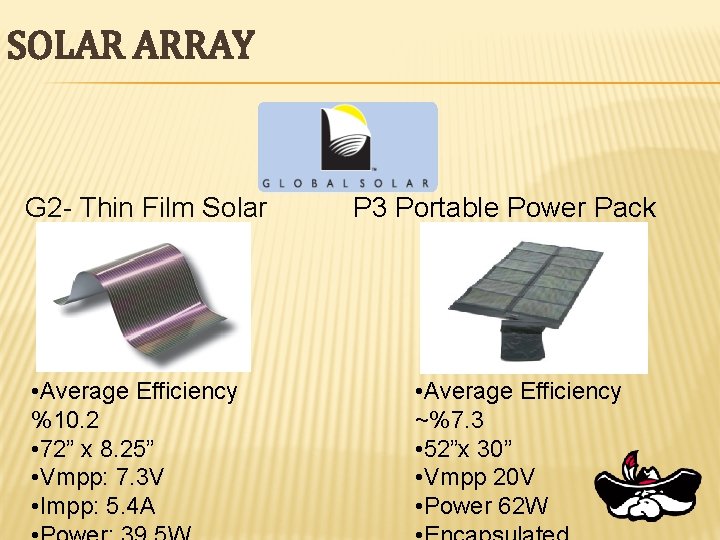
SOLAR ARRAY G 2 - Thin Film Solar Cells • Average Efficiency %10. 2 • 72” x 8. 25” • Vmpp: 7. 3 V • Impp: 5. 4 A P 3 Portable Power Pack • Average Efficiency ~%7. 3 • 52”x 30” • Vmpp 20 V • Power 62 W
CONSTRUCTION
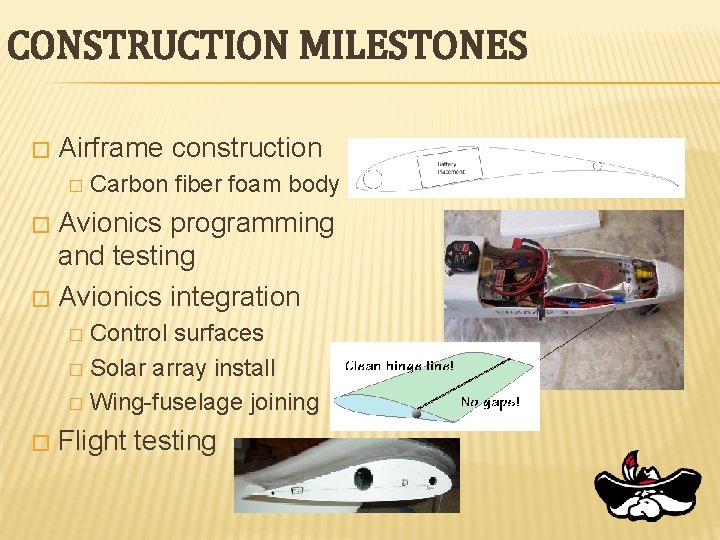
CONSTRUCTION MILESTONES � Airframe construction � Carbon fiber foam body Avionics programming and testing � Avionics integration � Control surfaces � Solar array install � Wing-fuselage joining � � Flight testing
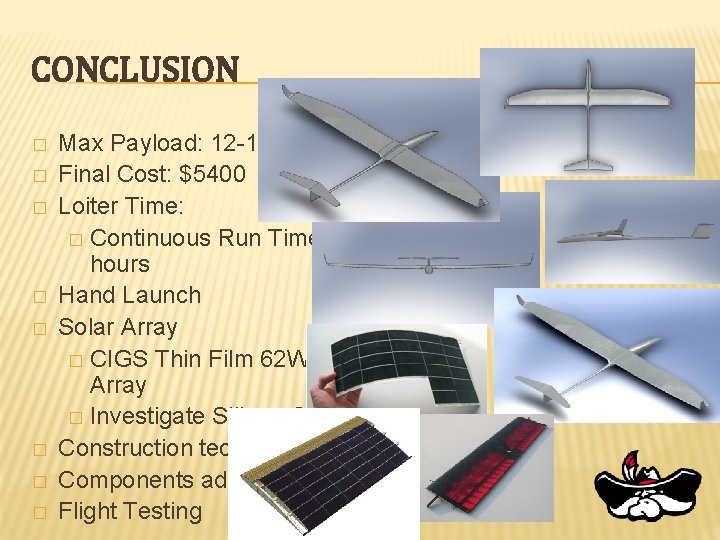
CONCLUSION � � � � Max Payload: 12 -15 lb Final Cost: $5400 Loiter Time: � Continuous Run Time: 7 hours Hand Launch Solar Array � CIGS Thin Film 62 W Array � Investigate Silicon Cells Construction technique Components advances Flight Testing
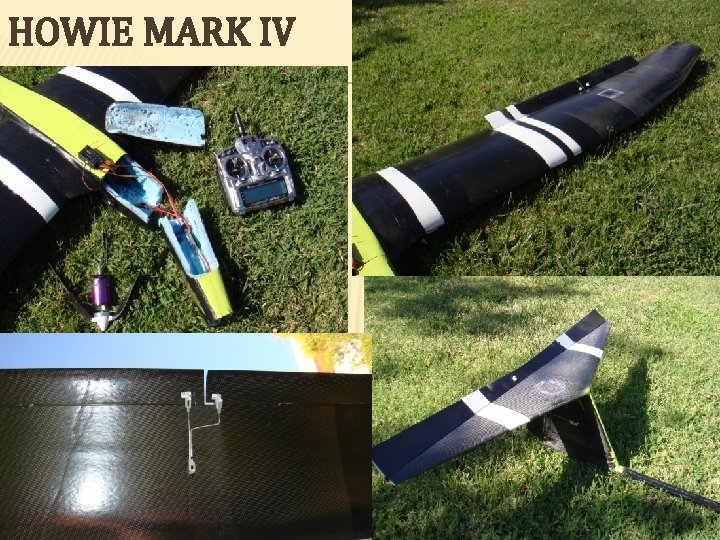
HOWIE MARK IV
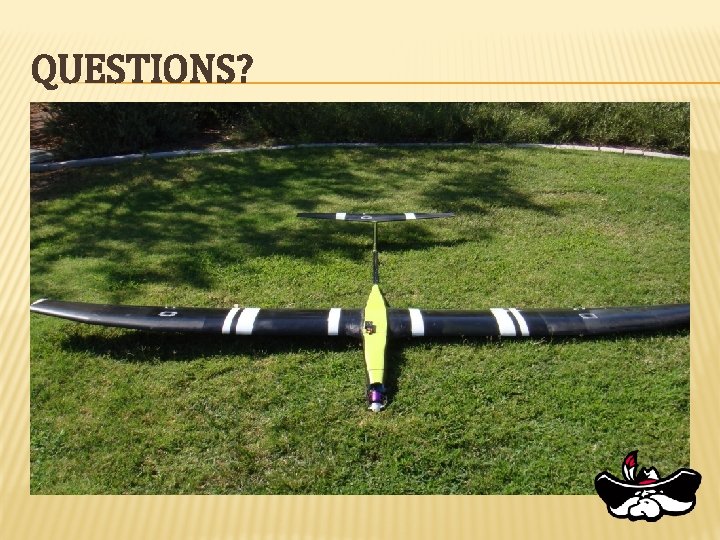
QUESTIONS?