
University of Palestine Engineering Hydraulics 2 nd semester









- Slides: 89
University of Palestine Engineering Hydraulics 2 nd semester 2010 -2011 CHAPTER 3: 1 Water Distribution Systems & networks
Water Distribution Systems & networks Content ØWater Distribution Systems ØDesign of Water Distribution Systems ØPipe Network Analysis 2
Water Distribution Systems & networks Part A Water Distribution Systems 3
Water Distribution Systems Introduction To deliver water to individual consumers with appropriate quality, quantity, and pressure in a community setting requires an extensive system of: Pipes. Storage reservoirs. Pumps. Other related accessories. Distribution system: is used to describe collectively the facilities used to supply water from its source to the point of usage. 4
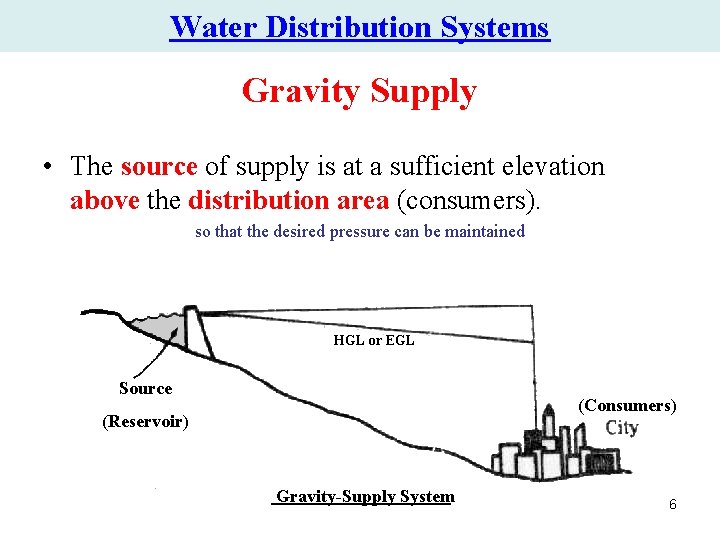
Water Distribution Systems Methods of Supplying Water • Depending on the topography relationship between the source of supply and the consumer, water can be transported by: • Canals. • Tunnels. • Pipelines. • The most common methods are: • Gravity supply • Pumped supply • Combined supply 5
Water Distribution Systems Gravity Supply • The source of supply is at a sufficient elevation above the distribution area (consumers). so that the desired pressure can be maintained HGL or EGL Source (Consumers) (Reservoir) Gravity-Supply System 6
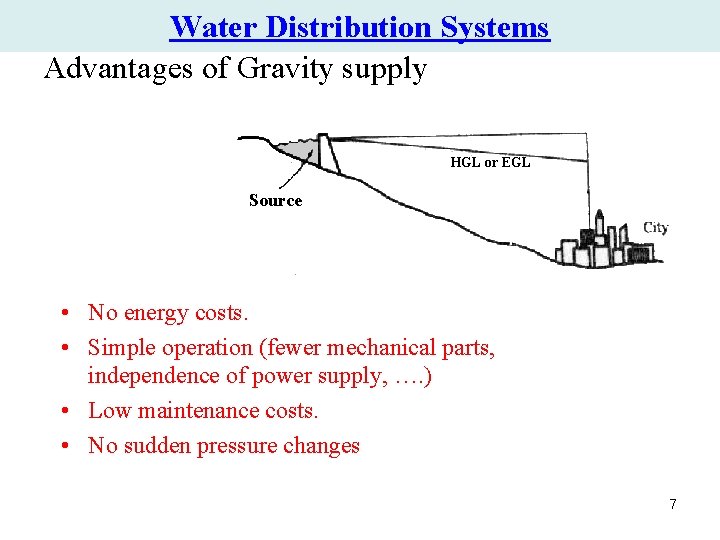
Water Distribution Systems Advantages of Gravity supply HGL or EGL Source • No energy costs. • Simple operation (fewer mechanical parts, independence of power supply, …. ) • Low maintenance costs. • No sudden pressure changes 7
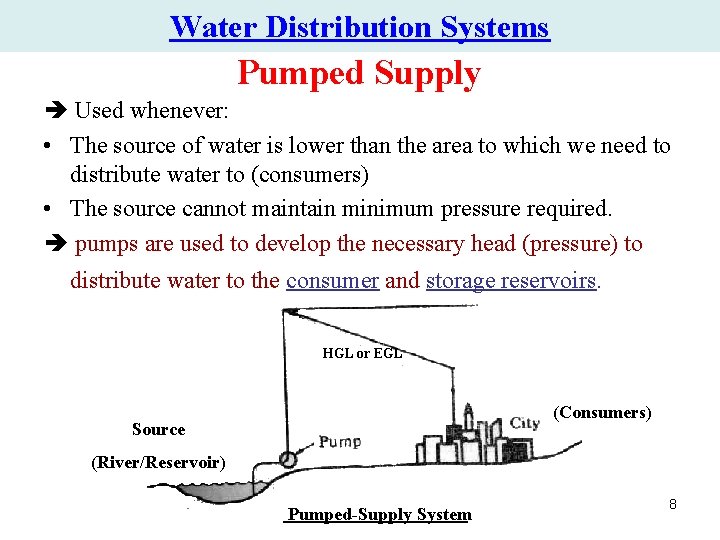
Water Distribution Systems Pumped Supply Used whenever: • The source of water is lower than the area to which we need to distribute water to (consumers) • The source cannot maintain minimum pressure required. pumps are used to develop the necessary head (pressure) to distribute water to the consumer and storage reservoirs. HGL or EGL (Consumers) Source (River/Reservoir) Pumped-Supply System 8
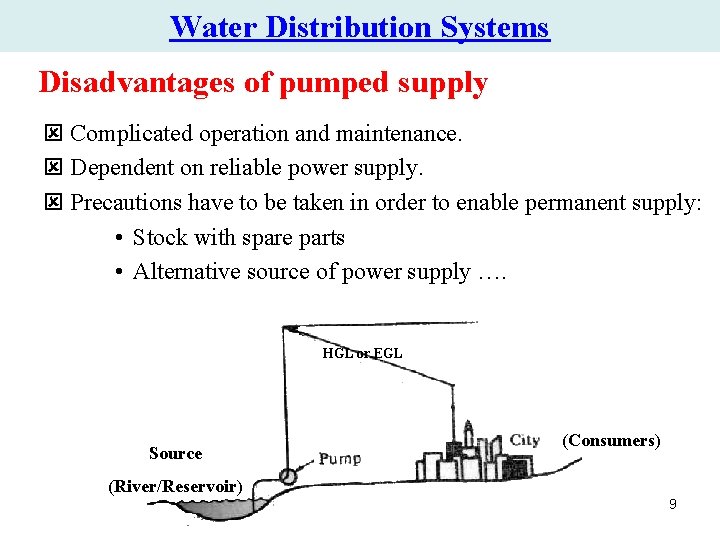
Water Distribution Systems Disadvantages of pumped supply ý Complicated operation and maintenance. ý Dependent on reliable power supply. ý Precautions have to be taken in order to enable permanent supply: • Stock with spare parts • Alternative source of power supply …. HGL or EGL Source (Consumers) (River/Reservoir) 9
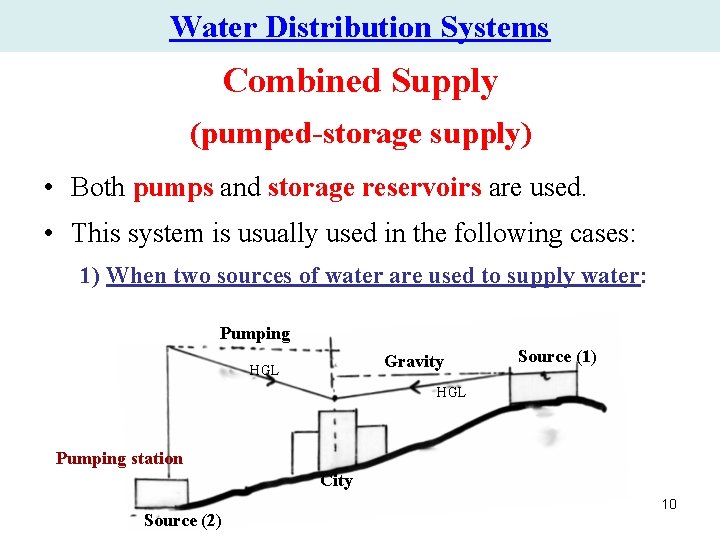
Water Distribution Systems Combined Supply (pumped-storage supply) • Both pumps and storage reservoirs are used. • This system is usually used in the following cases: 1) When two sources of water are used to supply water: Pumping Gravity HGL Source (1) HGL Pumping station City Source (2) 10
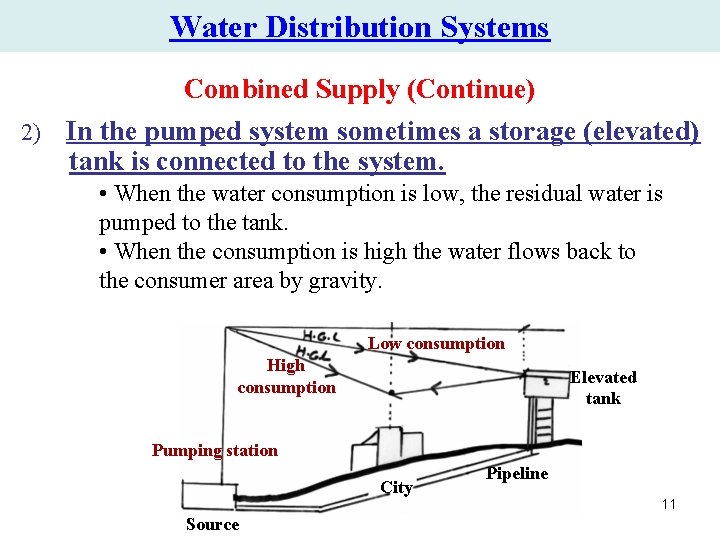
Water Distribution Systems Combined Supply (Continue) 2) In the pumped system sometimes a storage (elevated) tank is connected to the system. • When the water consumption is low, the residual water is pumped to the tank. • When the consumption is high the water flows back to the consumer area by gravity. Low consumption High consumption Elevated tank Pumping station City Source Pipeline 11
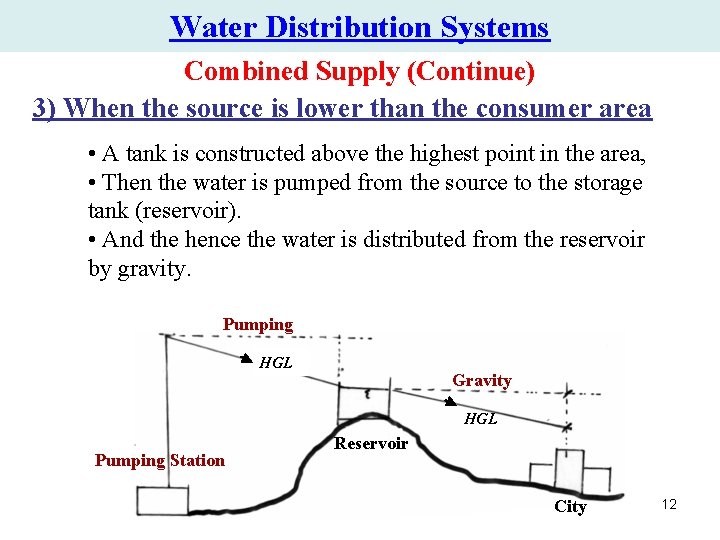
Water Distribution Systems Combined Supply (Continue) 3) When the source is lower than the consumer area • A tank is constructed above the highest point in the area, • Then the water is pumped from the source to the storage tank (reservoir). • And the hence the water is distributed from the reservoir by gravity. Pumping HGL Gravity HGL Pumping Station Reservoir City 12
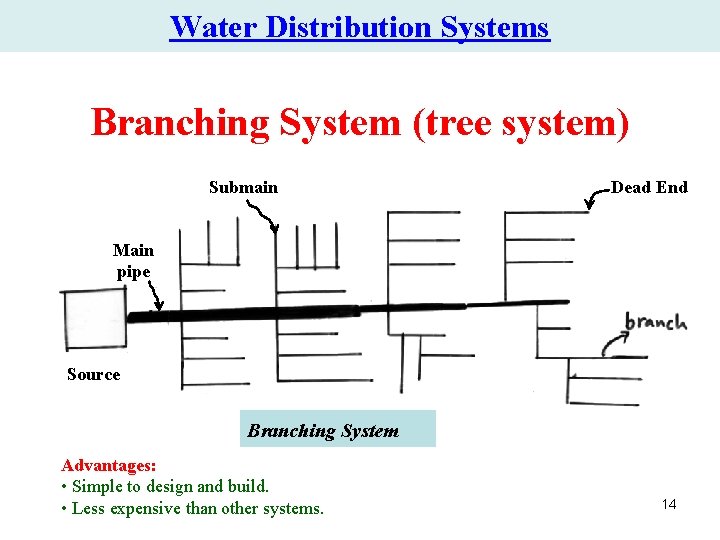
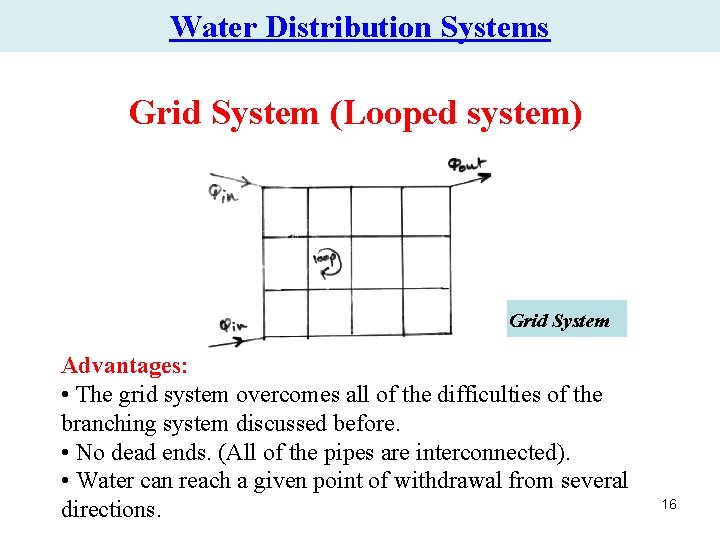
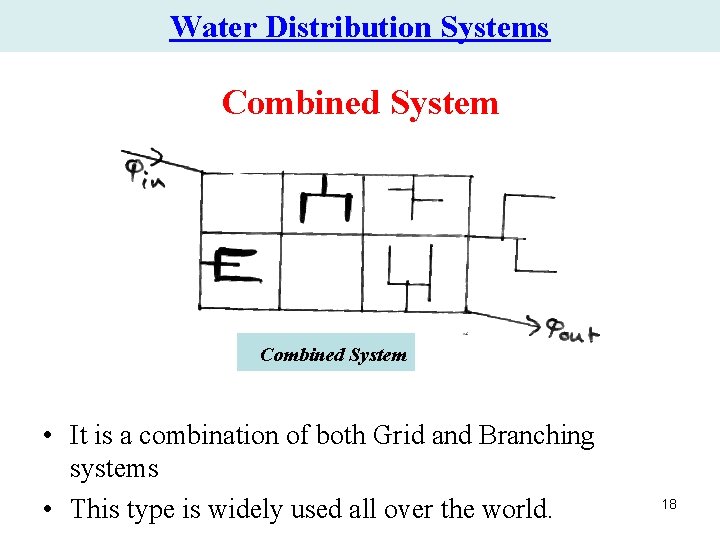
Water Distribution Systems (Network Configurations ) • In laying the pipes through the distribution area, the following configuration can be distinguished: 1. Branching system (Tree) 2. Grid system (Looped) 3. Combined system 13
Water Distribution Systems Branching System (tree system) Submain Dead End Main pipe Source Branching System Advantages: • Simple to design and build. • Less expensive than other systems. 14
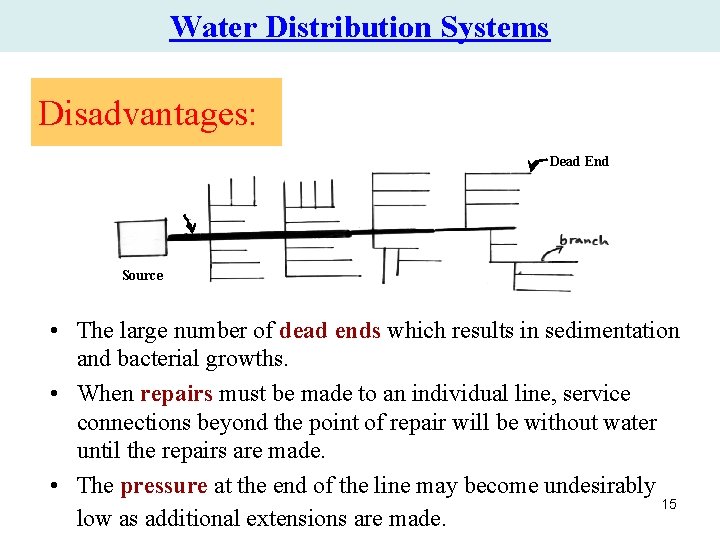
Water Distribution Systems Disadvantages: Dead End Source • The large number of dead ends which results in sedimentation and bacterial growths. • When repairs must be made to an individual line, service connections beyond the point of repair will be without water until the repairs are made. • The pressure at the end of the line may become undesirably 15 low as additional extensions are made.
Water Distribution Systems Grid System (Looped system) Grid System Advantages: • The grid system overcomes all of the difficulties of the branching system discussed before. • No dead ends. (All of the pipes are interconnected). • Water can reach a given point of withdrawal from several directions. 16
Water Distribution Systems Disadvantages: • Hydraulically far more complicated than branching system (Determination of the pipe sizes is somewhat more complicated). • Expensive (consists of a large number of loops). But, it is the most reliable and used system. 17
Water Distribution Systems Combined System • It is a combination of both Grid and Branching systems • This type is widely used all over the world. 18
Water Distribution Systems & networks Part B Design of Water Distribution Systems 19
Design of Water Distribution Systems A properly designed water distribution system should fulfill the following requirements: Main requirements : • Satisfied quality and quantity standards Additional requirements : • To enable reliable operation during irregular situations (power failure, fires. . ) • To be economically and financially viable, ensuring income for operation, maintenance and extension. 20 • To be flexible with respect to the future extensions.
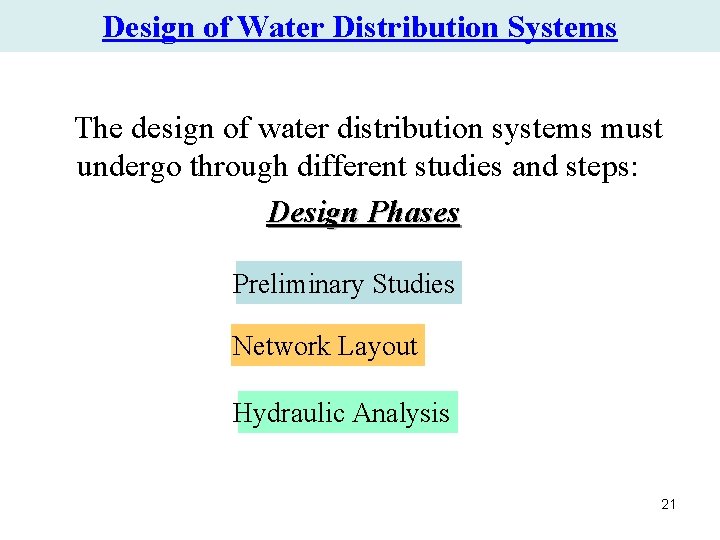
Design of Water Distribution Systems The design of water distribution systems must undergo through different studies and steps: Design Phases Preliminary Studies Network Layout Hydraulic Analysis 21
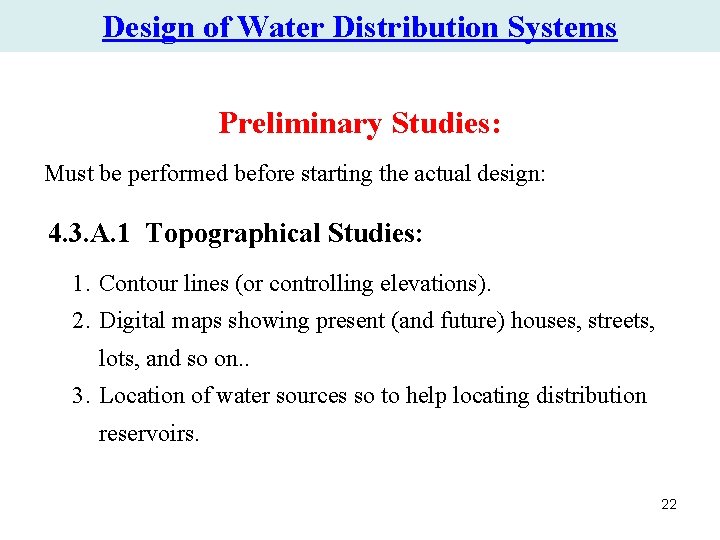
Design of Water Distribution Systems Preliminary Studies: Must be performed before starting the actual design: 4. 3. A. 1 Topographical Studies: 1. Contour lines (or controlling elevations). 2. Digital maps showing present (and future) houses, streets, lots, and so on. . 3. Location of water sources so to help locating distribution reservoirs. 22
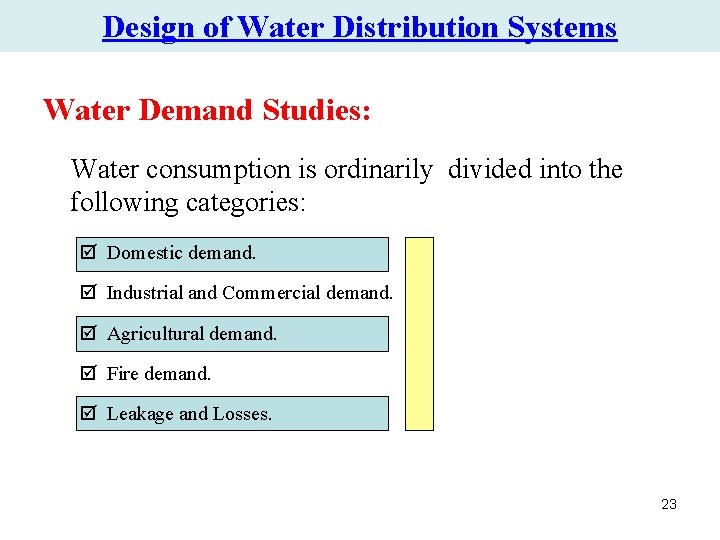
Design of Water Distribution Systems Water Demand Studies: Water consumption is ordinarily divided into the following categories: þ Domestic demand. þ Industrial and Commercial demand. þ Agricultural demand. þ Fire demand. þ Leakage and Losses. 23
Design of Water Distribution Systems Domestic demand • • It is the amount of water used for Drinking, Cocking, Gardening, Car Washing, Bathing, Laundry, Dish Washing, and Toilet Flushing. The average water consumption is different from one population to another. In Gaza strip the average consumption is 70 L/capita/day which is very low compared with other countries. For example, it is 250 L/c/day in United States, and it is 180 L/c/day for population live in Cairo (Egypt). The average consumption may increase with the increase in standard of living. The water consumption varies hourly, daily, and monthly 24
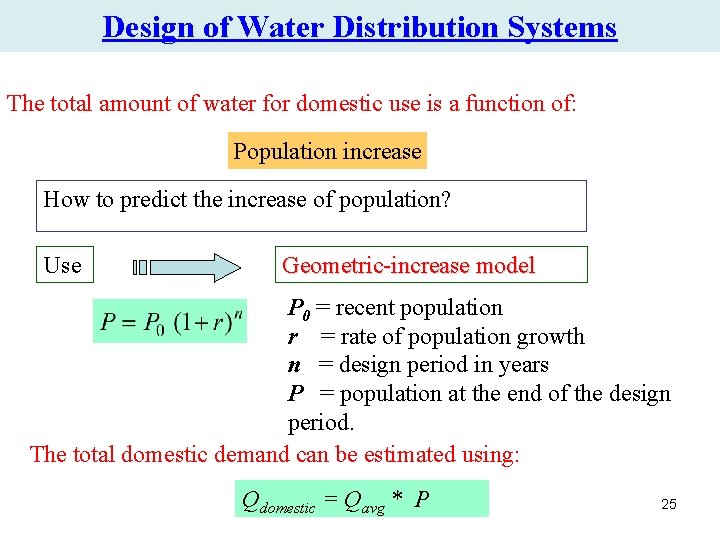
Design of Water Distribution Systems The total amount of water for domestic use is a function of: Population increase How to predict the increase of population? Use Geometric-increase model P 0 = recent population r = rate of population growth n = design period in years P = population at the end of the design period. The total domestic demand can be estimated using: Qdomestic = Qavg * P 25
Design of Water Distribution Systems Industrial and Commercial demand • It is the amount of water needed for factories, offices, and stores…. • Varies from one city to another and from one country to another • Hence should be studied for each case separately. • However, it is sometimes taken as a percentage of the domestic demand. 26
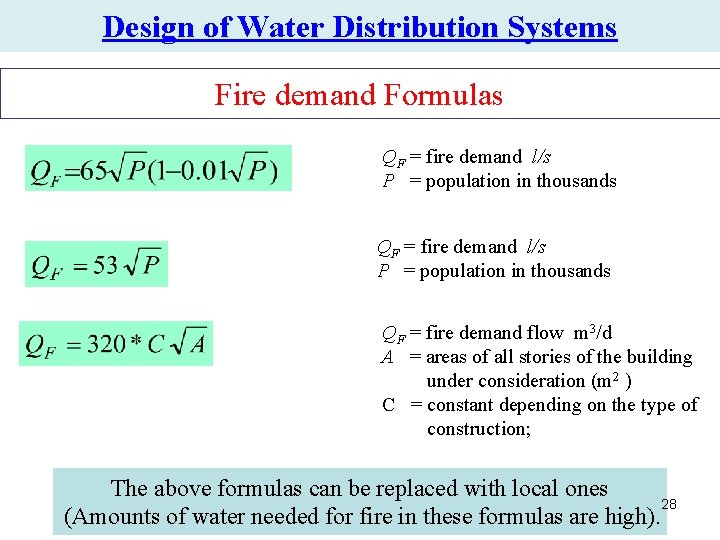
Design of Water Distribution Systems Agricultural demand • It depends on the type of crops, soil, climate… Fire demand • To resist fire, the network should save a certain amount of water. • Many formulas can be used to estimate the amount of water needed for fire. 27
Design of Water Distribution Systems Fire demand Formulas QF = fire demand l/s P = population in thousands QF = fire demand flow m 3/d A = areas of all stories of the building under consideration (m 2 ) C = constant depending on the type of construction; The above formulas can be replaced with local ones 28 (Amounts of water needed for fire in these formulas are high).
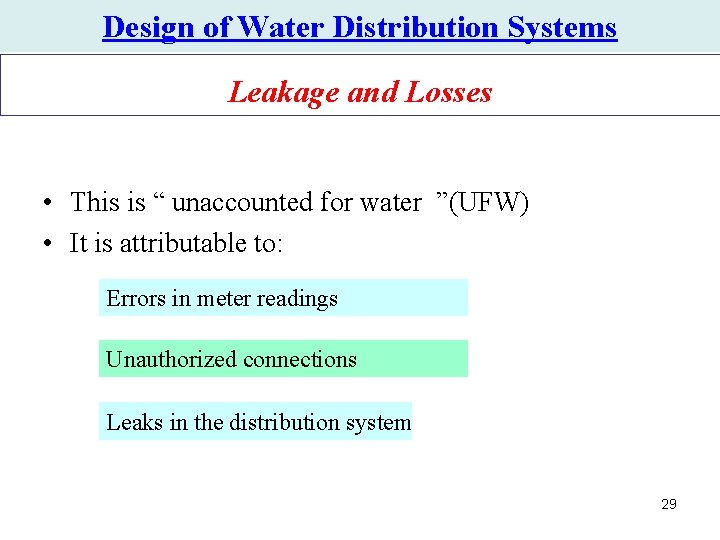
Design of Water Distribution Systems Leakage and Losses • This is “ unaccounted for water ”(UFW) • It is attributable to: Errors in meter readings Unauthorized connections Leaks in the distribution system 29
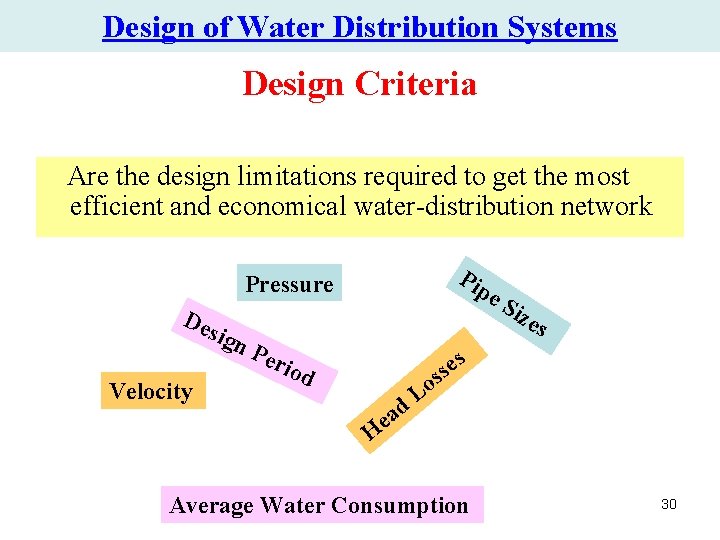
Design of Water Distribution Systems Design Criteria Are the design limitations required to get the most efficient and economical water-distribution network Pip Pressure De sig Velocity e. S n. P eri od d a e ize s es s s o L H Average Water Consumption 30
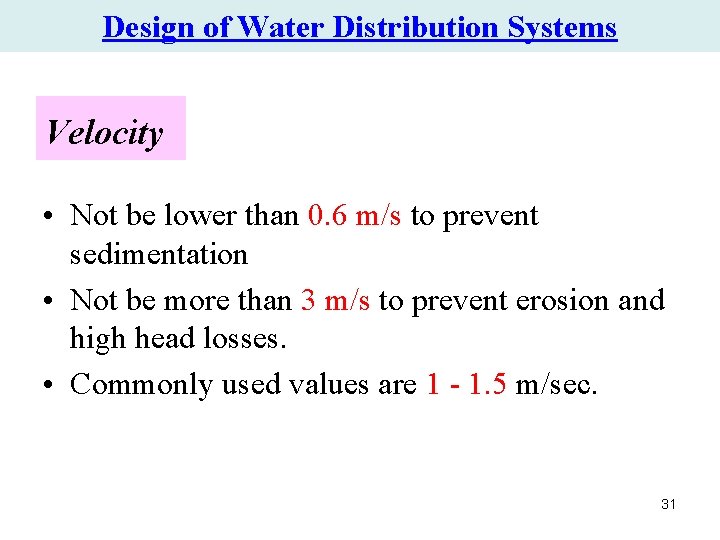
Design of Water Distribution Systems Velocity • Not be lower than 0. 6 m/s to prevent sedimentation • Not be more than 3 m/s to prevent erosion and high head losses. • Commonly used values are 1 - 1. 5 m/sec. 31
Design of Water Distribution Systems Pressure • Pressure in municipal distribution systems ranges from 150300 k. Pa in residential districts with structures of four stories or less and 400 -500 k. Pa in commercial districts. • Also, for fire hydrants the pressure should not be less than 150 k. Pa (15 m of water). • In general for any node in the network the pressure should not be less than 25 m of water. • Moreover, the maximum pressure should be limited to 70 m 32 of water
Design of Water Distribution Systems Pipe sizes • Lines which provide only domestic flow may be as small as 100 mm (4 in) but should not exceed 400 m in length (if dead-ended) or 600 m if connected to the system at both ends. • Lines as small as 50 -75 mm (2 -3 in) are sometimes used in small communities with length not to exceed 100 m (if dead-ended) or 200 m if connected at both ends. • The size of the small distribution mains is seldom less than 150 mm (6 in) with cross mains located at intervals not more than 180 m. • In high-value districts the minimum size is 200 mm (8 in) with crossmains at the same maximum spacing. Major streets are provided with lines not less than 305 mm (12 in) in diameter. 33
Design of Water Distribution Systems Head Losses • Optimum range is 1 -4 m/km. • Maximum head loss should not exceed 10 m/km. 34
Design of Water Distribution Systems Design Period for Water supply Components • The economic design period of the components of a distribution system depends on • Their life. • First cost. • And the ease of expandability. 35
Design of Water Distribution Systems Average Water Consumption • From the water demand (preliminary) studies, estimate the average and peak water consumption for the area. 36
Design of Water Distribution Systems Network Layout • Next step is to estimate pipe sizes on the basis of water demand local code requirements. • The pipes are then drawn on a digital map (using Auto. CAD, for example) starting from the water source. • All the components (pipes, valves, fire hydrants) of the water network should be shown on the lines. 37
Water Distribution Systems & networks Part C Pipe Network Analysis 38
Pipe Network Analysis 39
Pipe Network Analysis Pipe Networks • A hydraulic model is useful for examining the impact of design and operation decisions. • Simple systems, such as those discussed in last chapters can be solved using a hand calculator. • However, more complex systems require more effort even for steady state conditions, but, as in simple systems, the flow and pressure-head distribution through a water distribution system must satisfy the laws of conservation of mass and energy. 40
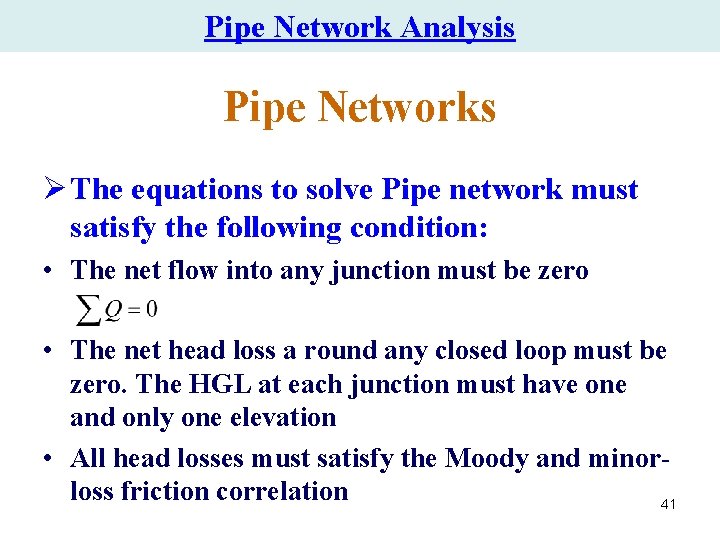
Pipe Network Analysis Pipe Networks Ø The equations to solve Pipe network must satisfy the following condition: • The net flow into any junction must be zero • The net head loss a round any closed loop must be zero. The HGL at each junction must have one and only one elevation • All head losses must satisfy the Moody and minorloss friction correlation 41
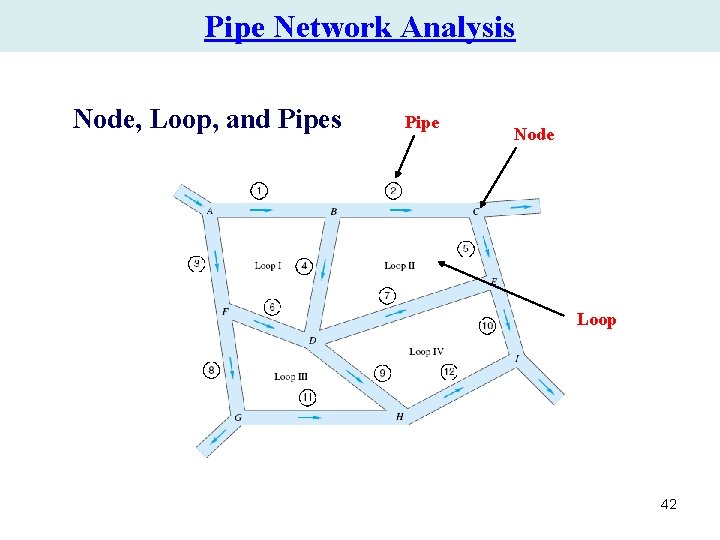
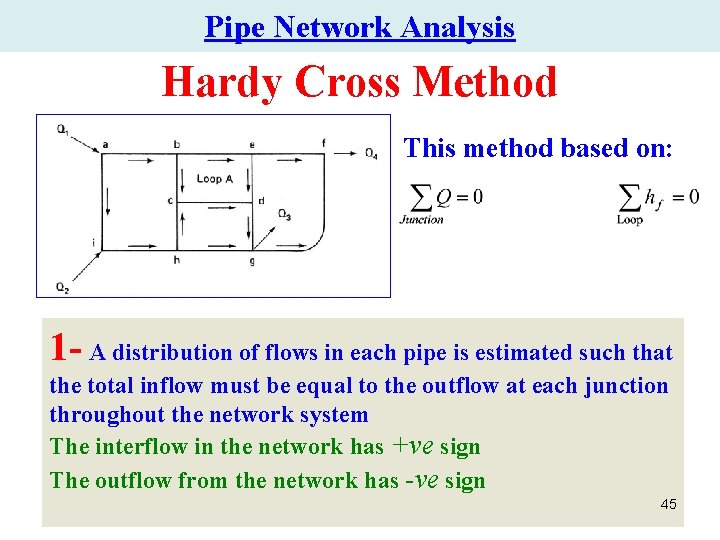
Pipe Network Analysis Node, Loop, and Pipes Pipe Node Loop 42
Pipe Network Analysis Hydraulic Analysis After completing all preliminary studies and layout drawing of the network, one of the methods of hydraulic analysis is used to • Size the pipes and • Assign the pressures and velocities required. 43
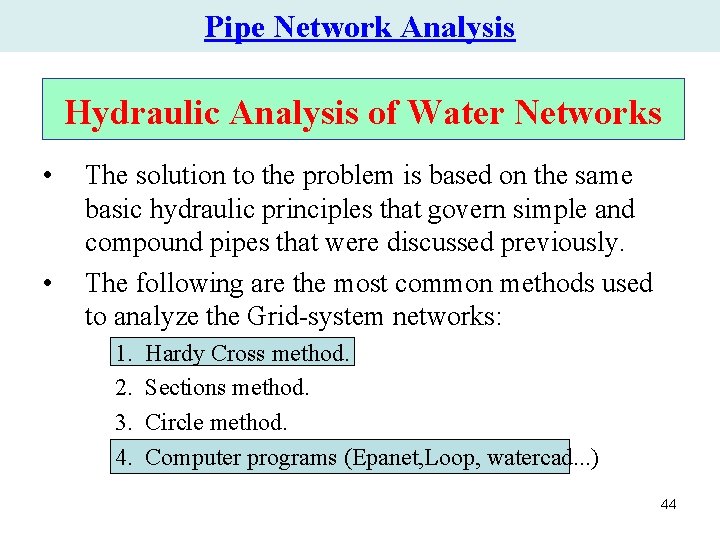
Pipe Network Analysis Hydraulic Analysis of Water Networks • • The solution to the problem is based on the same basic hydraulic principles that govern simple and compound pipes that were discussed previously. The following are the most common methods used to analyze the Grid-system networks: 1. 2. 3. 4. Hardy Cross method. Sections method. Circle method. Computer programs (Epanet, Loop, watercad. . . ) 44
Pipe Network Analysis Hardy Cross Method This method based on: 1 - A distribution of flows in each pipe is estimated such that the total inflow must be equal to the outflow at each junction throughout the network system The interflow in the network has +ve sign The outflow from the network has -ve sign 45
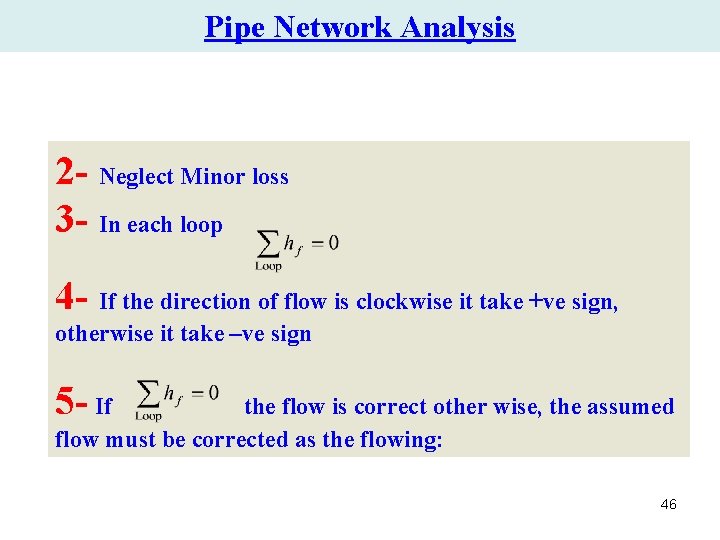
Pipe Network Analysis 2 - Neglect Minor loss 3 - In each loop 4 - If the direction of flow is clockwise it take +ve sign, otherwise it take –ve sign 5 - If the flow is correct other wise, the assumed flow must be corrected as the flowing: 46
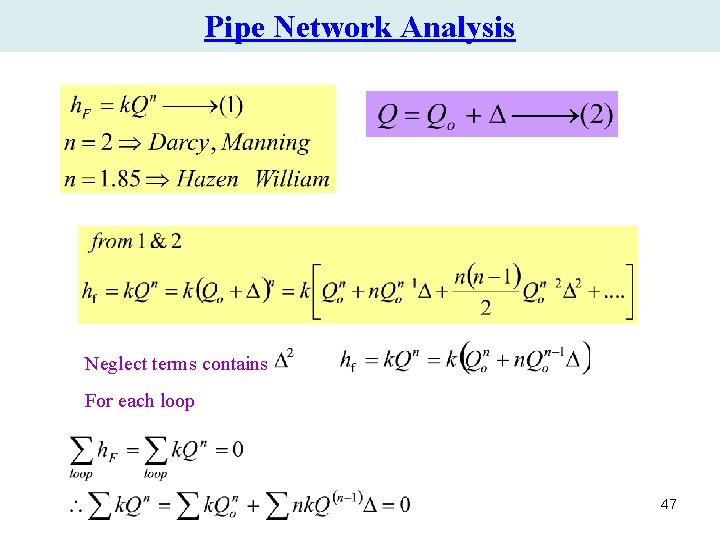
Pipe Network Analysis Neglect terms contains For each loop 47
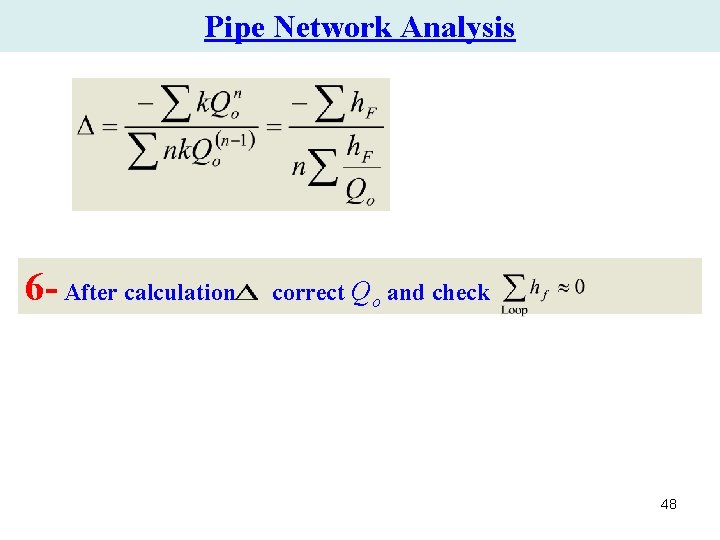
Pipe Network Analysis 6 - After calculation correct Qo and check 48
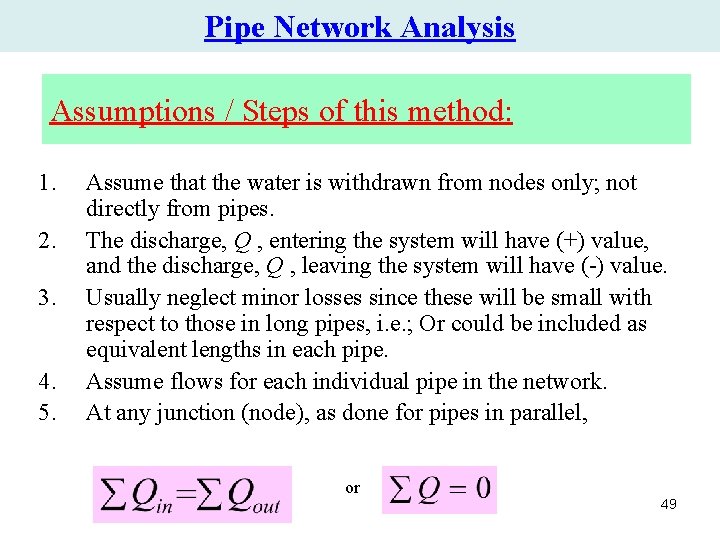
Pipe Network Analysis Assumptions / Steps of this method: 1. 2. 3. 4. 5. Assume that the water is withdrawn from nodes only; not directly from pipes. The discharge, Q , entering the system will have (+) value, and the discharge, Q , leaving the system will have (-) value. Usually neglect minor losses since these will be small with respect to those in long pipes, i. e. ; Or could be included as equivalent lengths in each pipe. Assume flows for each individual pipe in the network. At any junction (node), as done for pipes in parallel, or 49
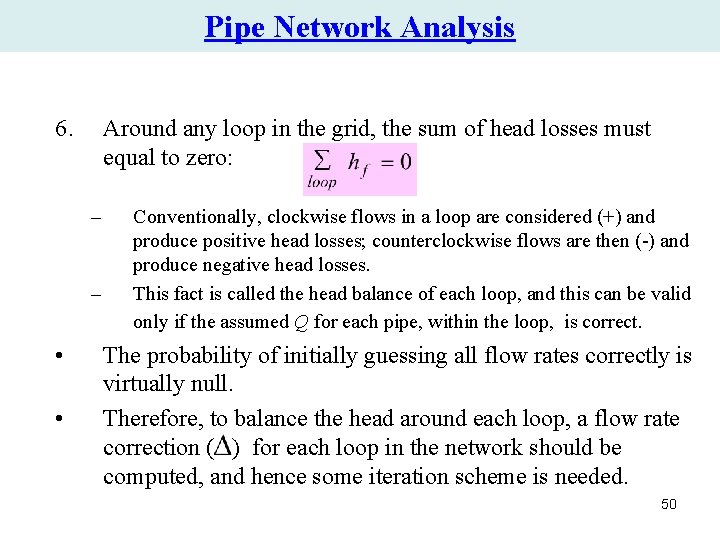
Pipe Network Analysis 6. Around any loop in the grid, the sum of head losses must equal to zero: – – • • Conventionally, clockwise flows in a loop are considered (+) and produce positive head losses; counterclockwise flows are then (-) and produce negative head losses. This fact is called the head balance of each loop, and this can be valid only if the assumed Q for each pipe, within the loop, is correct. The probability of initially guessing all flow rates correctly is virtually null. Therefore, to balance the head around each loop, a flow rate correction ( ) for each loop in the network should be computed, and hence some iteration scheme is needed. 50
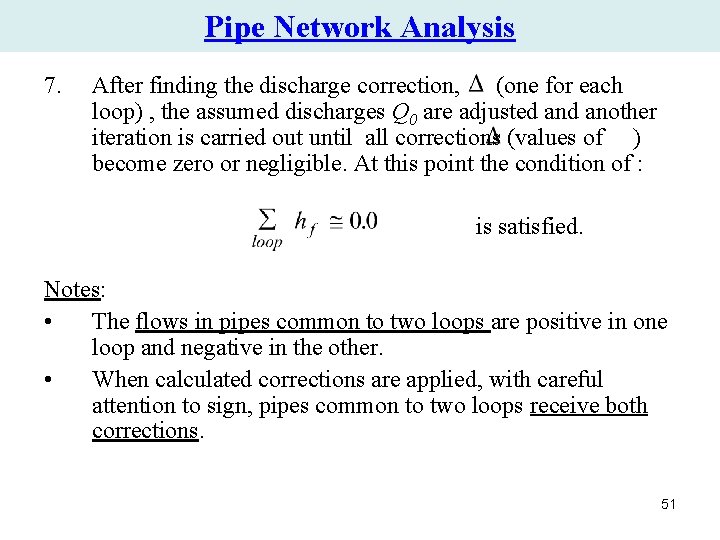
Pipe Network Analysis 7. After finding the discharge correction, (one for each loop) , the assumed discharges Q 0 are adjusted another iteration is carried out until all corrections (values of ) become zero or negligible. At this point the condition of : is satisfied. Notes: • The flows in pipes common to two loops are positive in one loop and negative in the other. • When calculated corrections are applied, with careful attention to sign, pipes common to two loops receive both corrections. 51
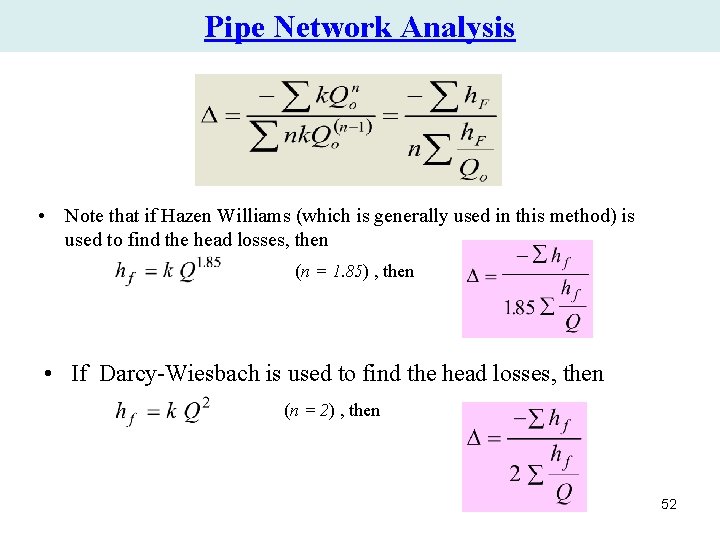
Pipe Network Analysis • Note that if Hazen Williams (which is generally used in this method) is used to find the head losses, then (n = 1. 85) , then • If Darcy-Wiesbach is used to find the head losses, then (n = 2) , then 52
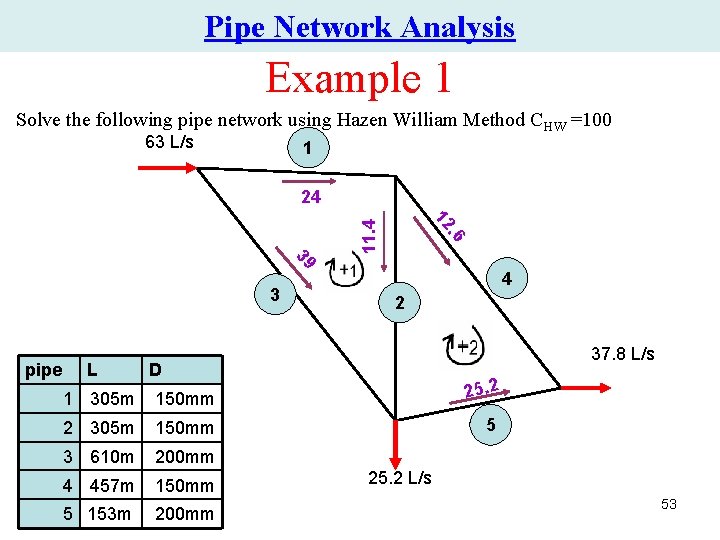
Pipe Network Analysis Example 1 Solve the following pipe network using Hazen William Method CHW =100 63 L/s 1 24 . 6 11. 4 12 39 3 pipe L 4 2 37. 8 L/s D 1 305 m 150 mm 25. 2 2 305 m 150 mm 5 3 610 m 200 mm 4 457 m 150 mm 5 153 m 200 mm 25. 2 L/s 53
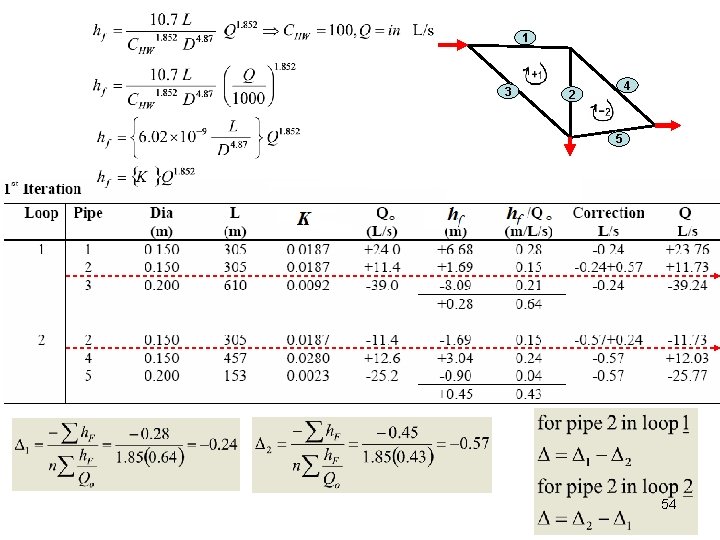
1 3 4 2 5 54
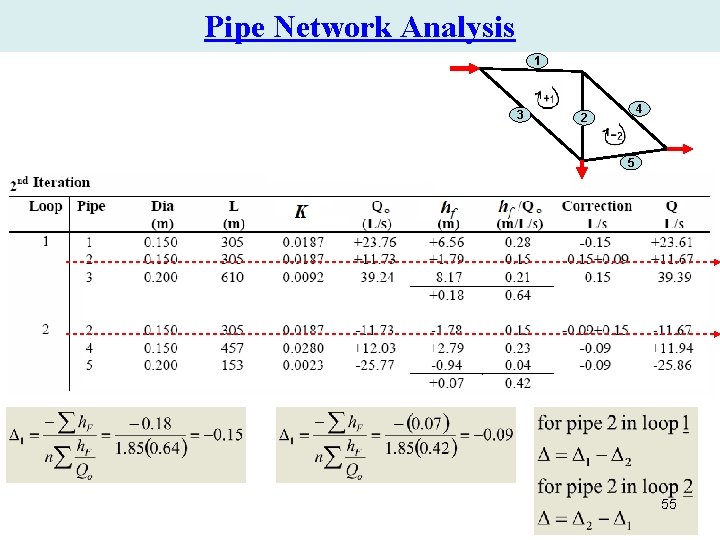
Pipe Network Analysis 1 3 4 2 5 55
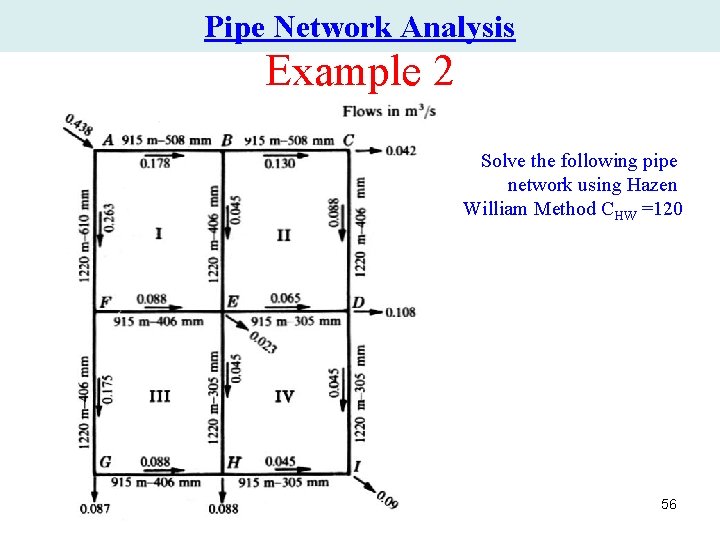
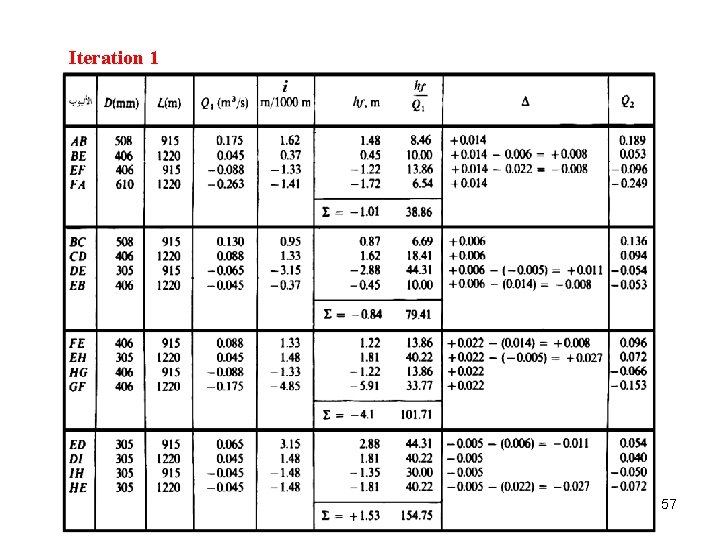
Pipe Network Analysis Example 2 Solve the following pipe network using Hazen William Method CHW =120 56
Iteration 1 57
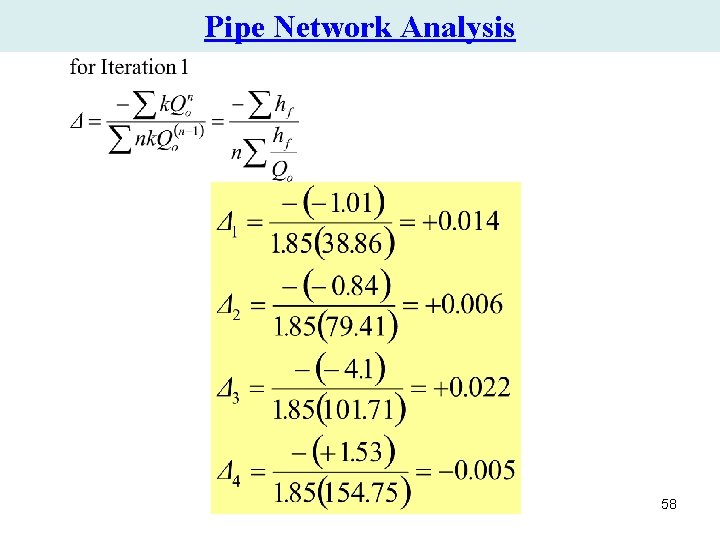
Pipe Network Analysis 58
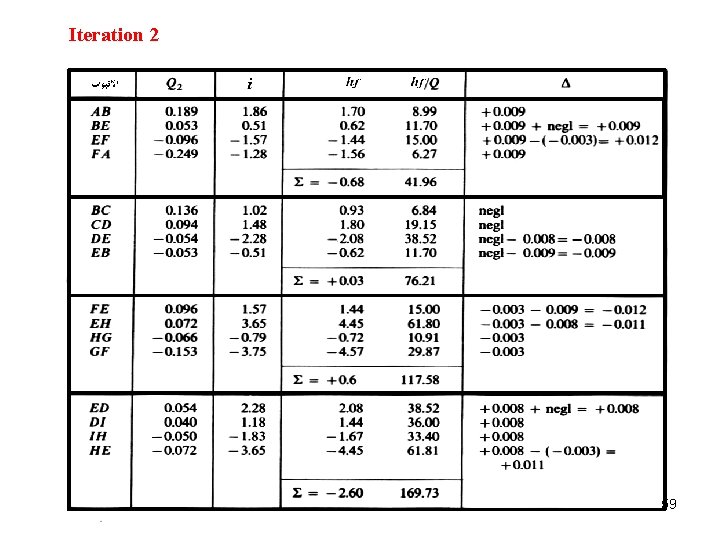
Iteration 2 59
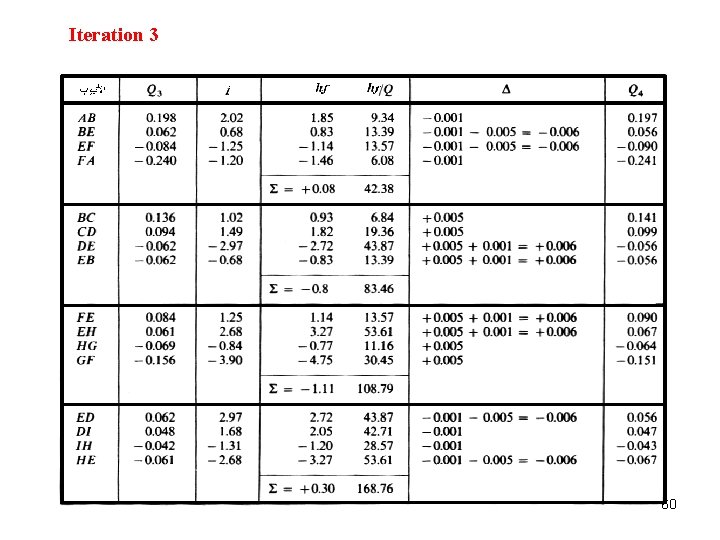
Iteration 3 60
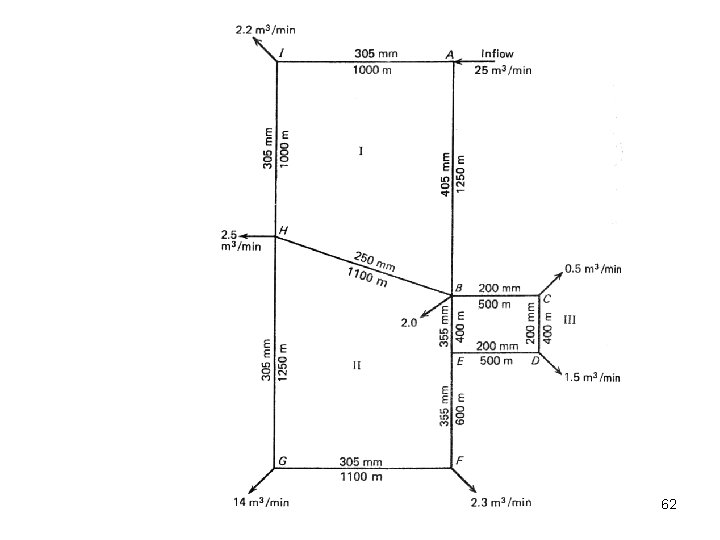
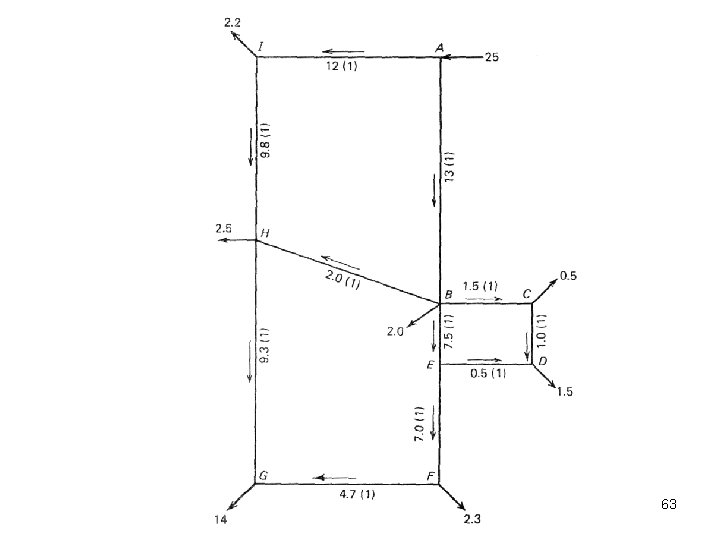
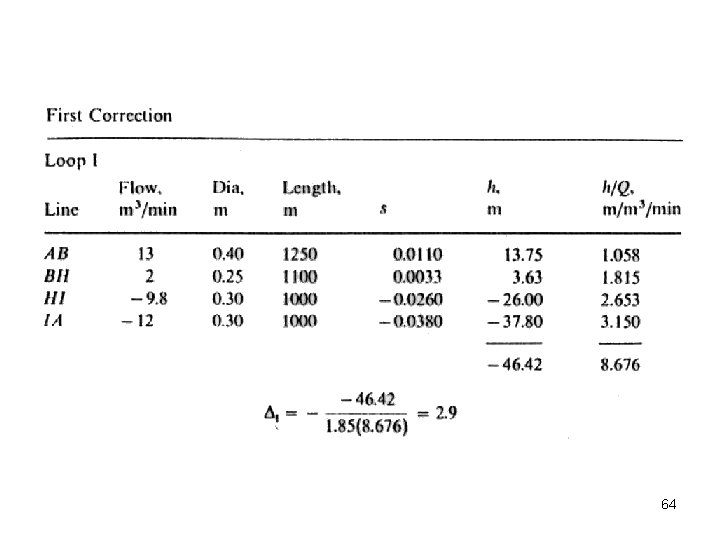
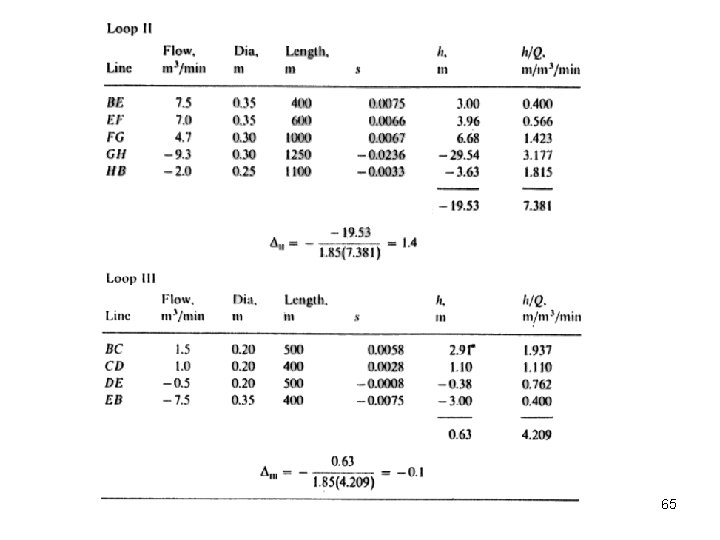
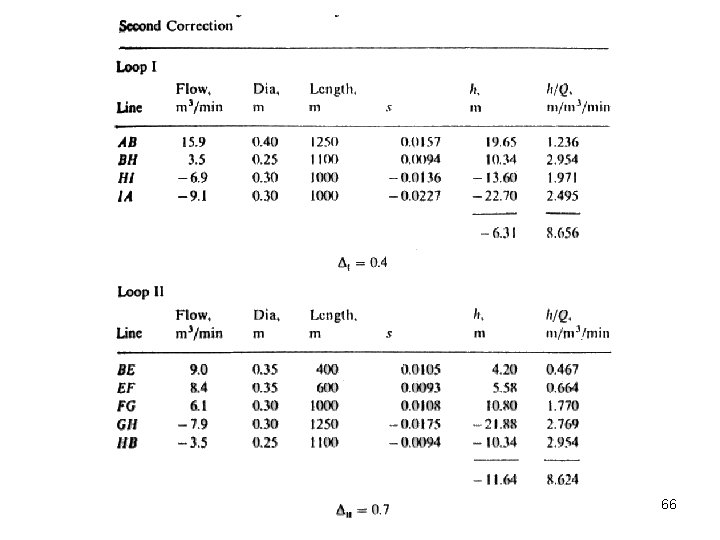
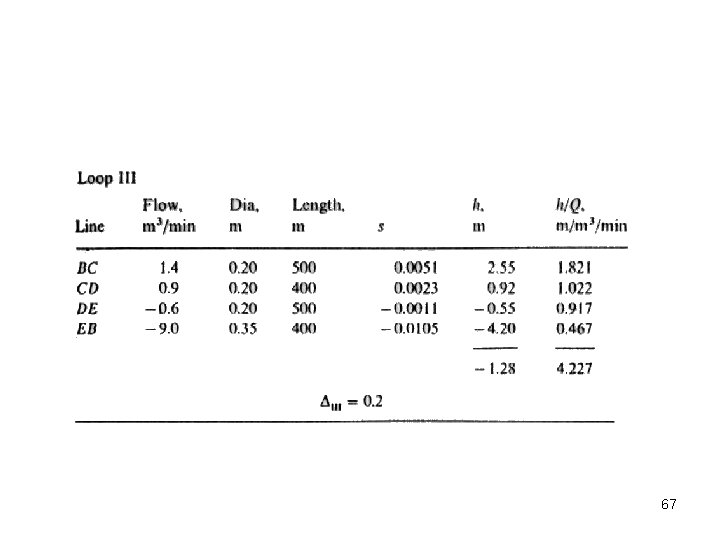
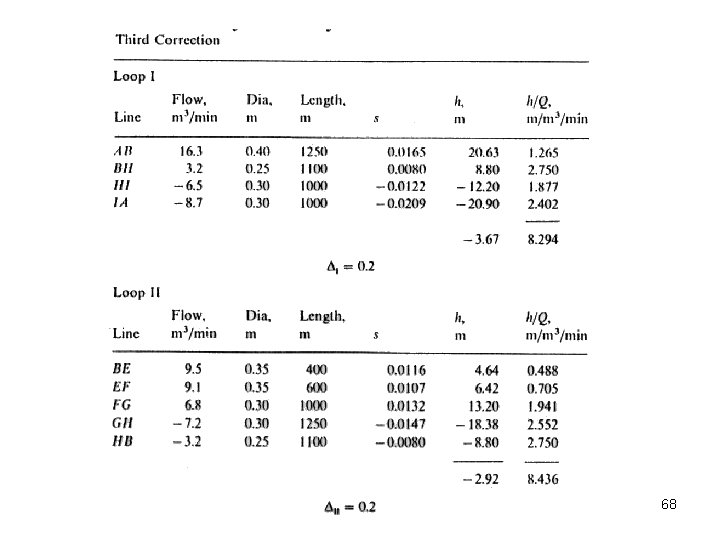
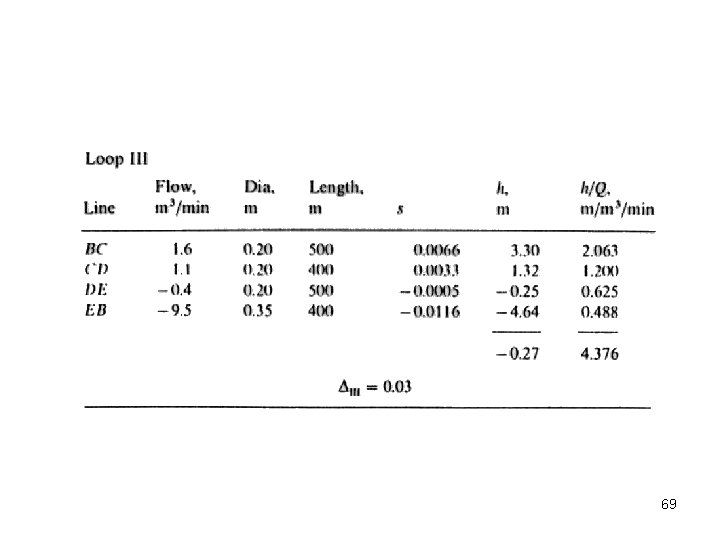
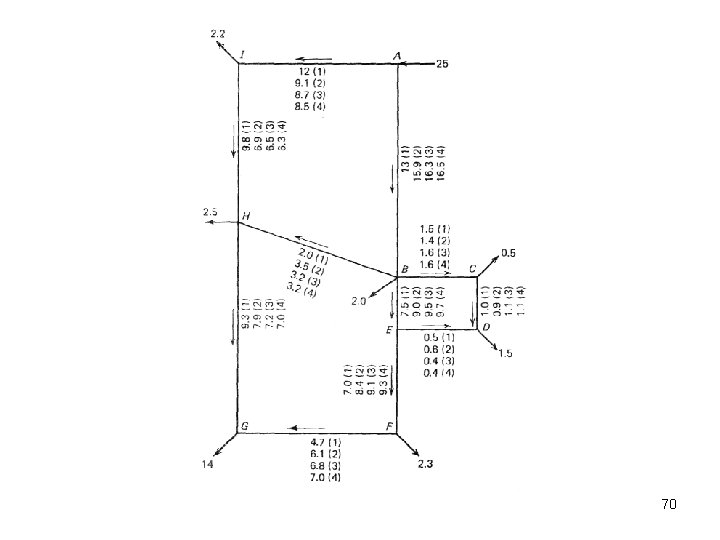
Pipe Network Analysis Example • The figure below represents a simplified pipe network. • Flows for the area have been disaggregated to the nodes, and a major fire flow has been added at node G. • The water enters the system at node A. • Pipe diameters and lengths are shown on the figure. • Find the flow rate of water in each pipe using the Hazen. Williams equation with CHW = 100. • Carry out calculations until the corrections are less then 61 0. 2 m 3/min.
62
63
64
65
66
67
68
69
70
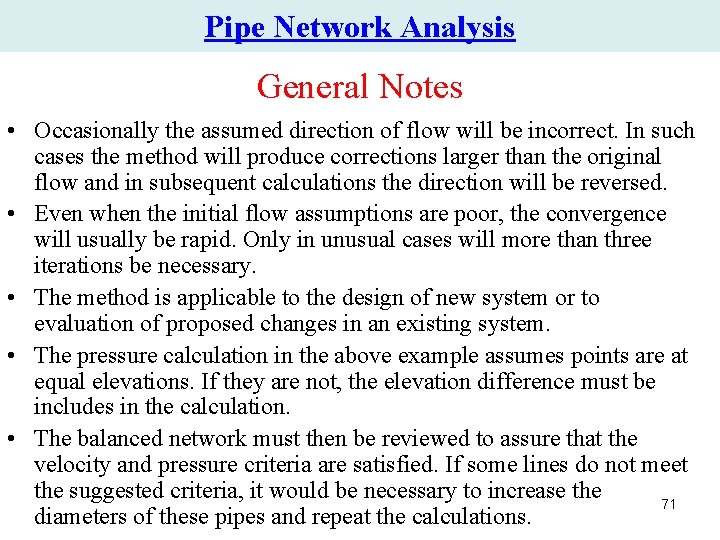
Pipe Network Analysis General Notes • Occasionally the assumed direction of flow will be incorrect. In such cases the method will produce corrections larger than the original flow and in subsequent calculations the direction will be reversed. • Even when the initial flow assumptions are poor, the convergence will usually be rapid. Only in unusual cases will more than three iterations be necessary. • The method is applicable to the design of new system or to evaluation of proposed changes in an existing system. • The pressure calculation in the above example assumes points are at equal elevations. If they are not, the elevation difference must be includes in the calculation. • The balanced network must then be reviewed to assure that the velocity and pressure criteria are satisfied. If some lines do not meet the suggested criteria, it would be necessary to increase the 71 diameters of these pipes and repeat the calculations.
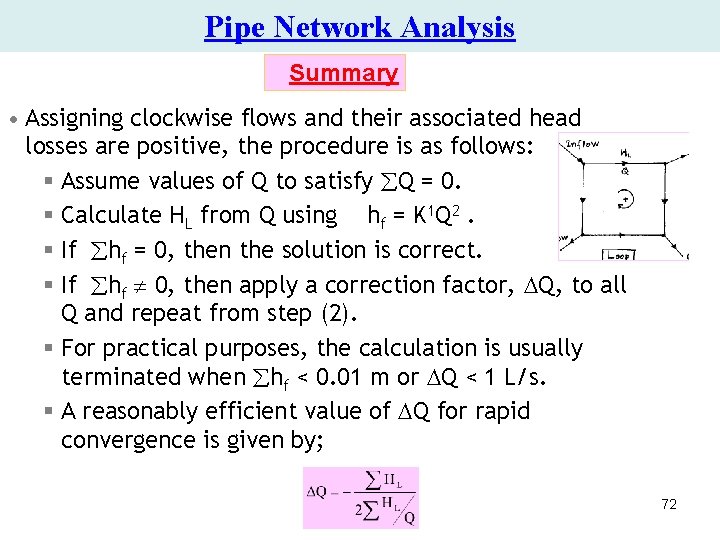
Pipe Network Analysis Summary • Assigning clockwise flows and their associated head losses are positive, the procedure is as follows: § Assume values of Q to satisfy Q = 0. § Calculate HL from Q using hf = K 1 Q 2. § If hf = 0, then the solution is correct. § If hf 0, then apply a correction factor, Q, to all Q and repeat from step (2). § For practical purposes, the calculation is usually terminated when hf < 0. 01 m or Q < 1 L/s. § A reasonably efficient value of Q for rapid convergence is given by; 72
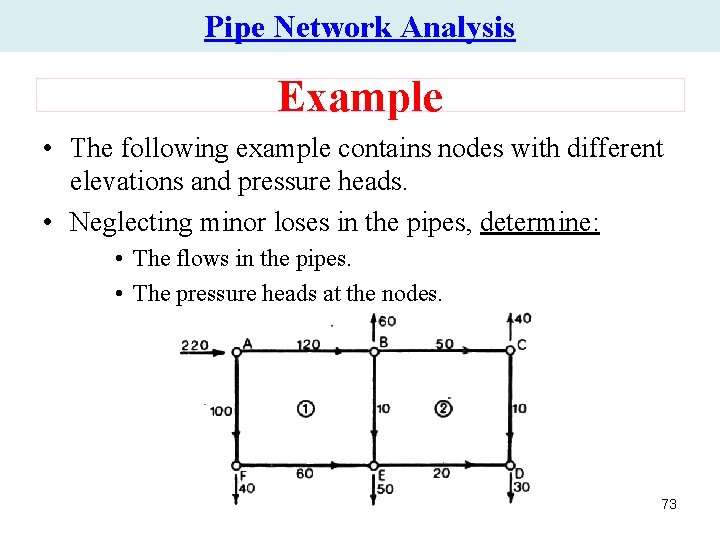
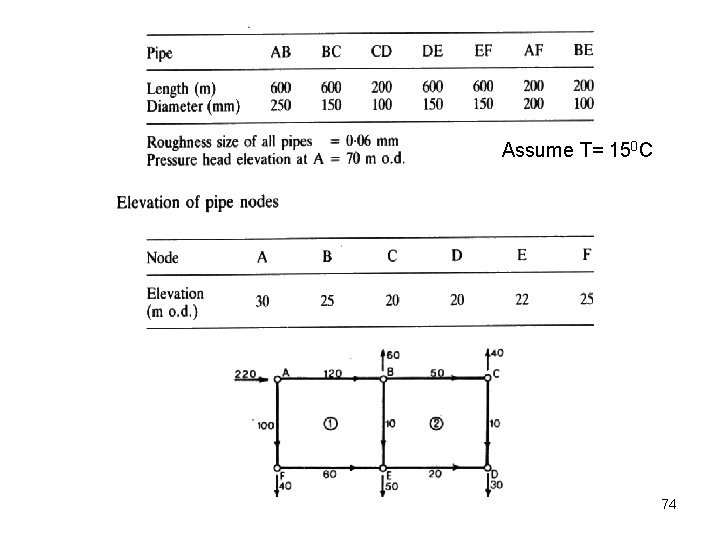
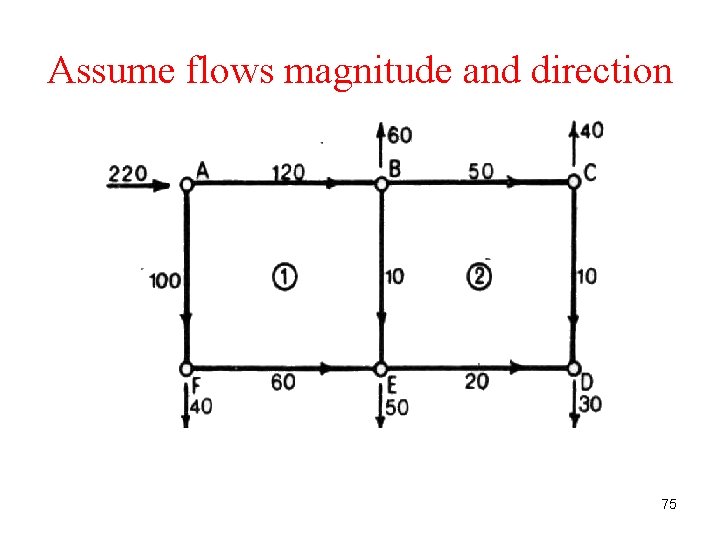
Pipe Network Analysis Example • The following example contains nodes with different elevations and pressure heads. • Neglecting minor loses in the pipes, determine: • The flows in the pipes. • The pressure heads at the nodes. 73
Assume T= 150 C 74
Assume flows magnitude and direction 75
First Iteration • Loop (1) Pipe L (m) D (m) Q (m 3/s) f hf (m) hf/Q (m/m 3/s) AB 600 0. 25 0. 12 0. 0157 11. 48 95. 64 BE 200 0. 10 0. 01 0. 0205 3. 38 338. 06 EF 600 0. 15 -0. 06 0. 0171 -40. 25 670. 77 FA 200 0. 20 -0. 10 0. 0162 -8. 34 83. 42 S -33. 73 1187. 89 76
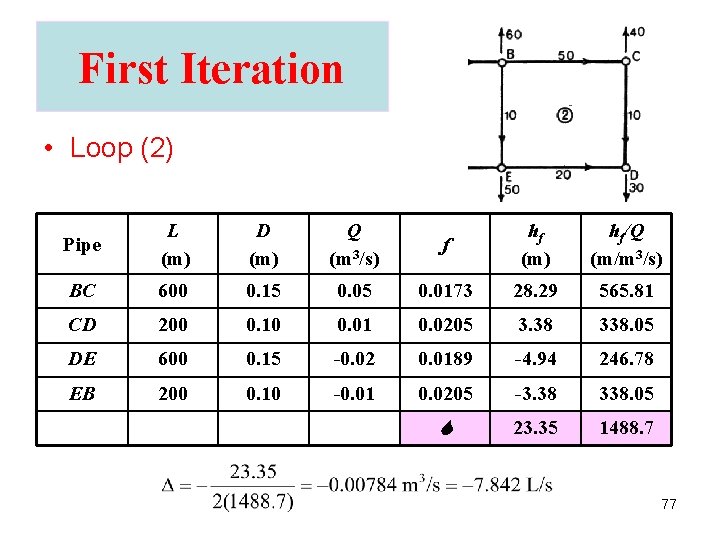
First Iteration • Loop (2) Pipe L (m) D (m) Q (m 3/s) f hf (m) hf/Q (m/m 3/s) BC 600 0. 15 0. 0173 28. 29 565. 81 CD 200 0. 10 0. 01 0. 0205 3. 38 338. 05 DE 600 0. 15 -0. 02 0. 0189 -4. 94 246. 78 EB 200 0. 10 -0. 01 0. 0205 -3. 38 338. 05 S 23. 35 1488. 7 77
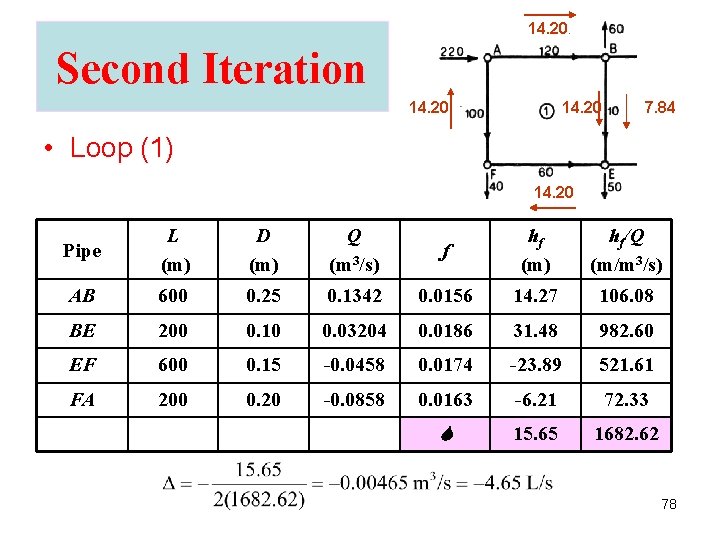
14. 20 Second Iteration 14. 20 7. 84 • Loop (1) 14. 20 Pipe L (m) D (m) Q (m 3/s) f hf (m) hf/Q (m/m 3/s) AB 600 0. 25 0. 1342 0. 0156 14. 27 106. 08 BE 200 0. 10 0. 03204 0. 0186 31. 48 982. 60 EF 600 0. 15 -0. 0458 0. 0174 -23. 89 521. 61 FA 200 0. 20 -0. 0858 0. 0163 -6. 21 72. 33 S 15. 65 1682. 62 78
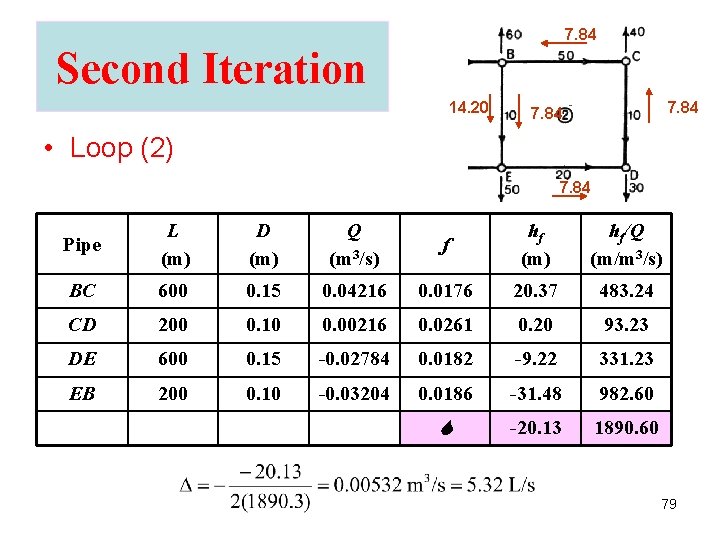
7. 84 Second Iteration 14. 20 7. 84 • Loop (2) 7. 84 Pipe L (m) D (m) Q (m 3/s) f hf (m) hf/Q (m/m 3/s) BC 600 0. 15 0. 04216 0. 0176 20. 37 483. 24 CD 200 0. 10 0. 00216 0. 0261 0. 20 93. 23 DE 600 0. 15 -0. 02784 0. 0182 -9. 22 331. 23 EB 200 0. 10 -0. 03204 0. 0186 -31. 48 982. 60 S -20. 13 1890. 60 79
Third Iteration • Loop (1) Pipe L (m) D (m) Q (m 3/s) f hf (m) hf/Q (m/m 3/s) AB 600 0. 25 0. 1296 0. 0156 13. 30 102. 67 BE 200 0. 10 0. 02207 0. 0190 15. 30 693. 08 EF 600 0. 15 -0. 05045 0. 0173 -28. 78 570. 54 FA 200 0. 20 -0. 09045 0. 0163 -6. 87 75. 97 S -7. 05 1442. 26 80
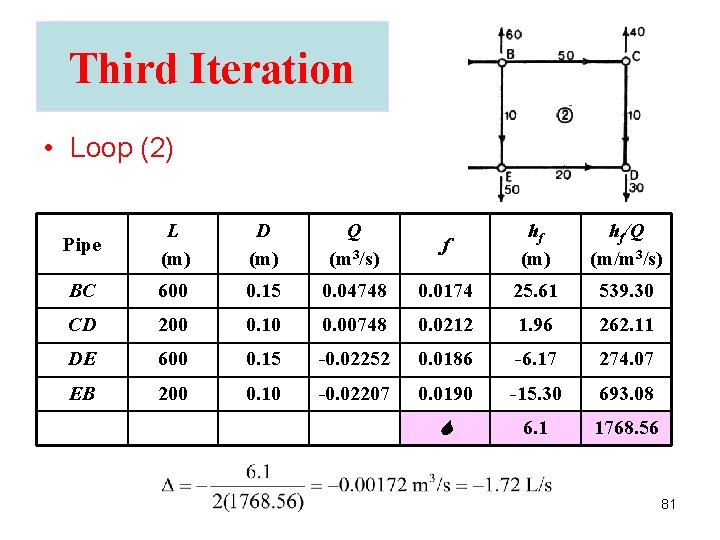
Third Iteration • Loop (2) Pipe L (m) D (m) Q (m 3/s) f hf (m) hf/Q (m/m 3/s) BC 600 0. 15 0. 04748 0. 0174 25. 61 539. 30 CD 200 0. 10 0. 00748 0. 0212 1. 96 262. 11 DE 600 0. 15 -0. 02252 0. 0186 -6. 17 274. 07 EB 200 0. 10 -0. 02207 0. 0190 -15. 30 693. 08 S 6. 1 1768. 56 81
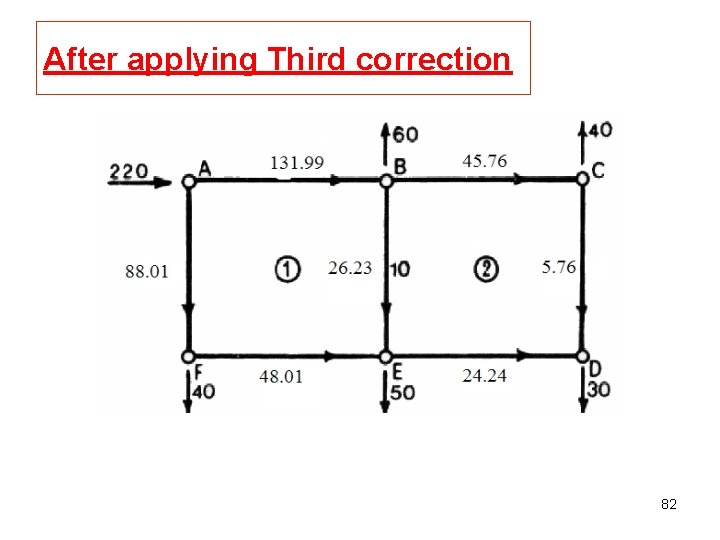
After applying Third correction 82
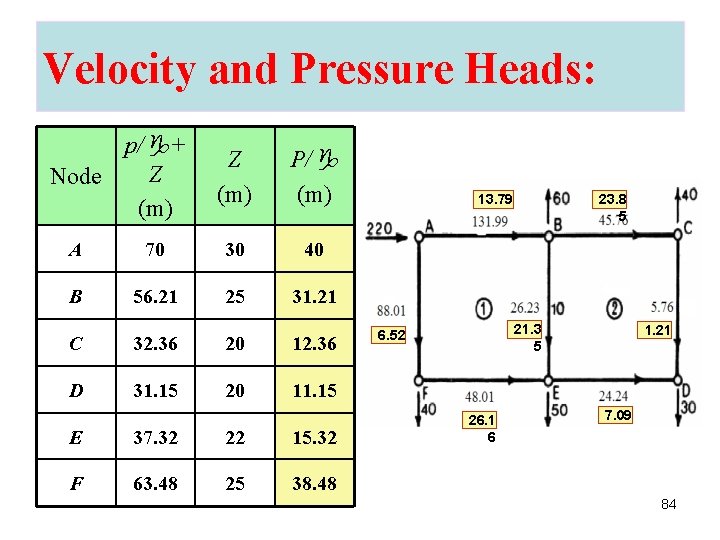
Velocity and Pressure Heads: Q (l/s) V (m/s) hf (m) AB 131. 99 2. 689 13. 79 BE 26. 23 3. 340 21. 35 FE 48. 01 2. 717 26. 16 AF 88. 01 2. 801 6. 52 BC 45. 76 2. 589 23. 85 CD 5. 76 0. 733 1. 21 ED 24. 24 1. 372 7. 09 pipe 13. 79 6. 52 23. 8 5 1. 21 21. 3 5 26. 1 6 7. 09 83
Velocity and Pressure Heads: p/g+ Z Node (m) Z (m) P/g (m) A 70 30 40 B 56. 21 25 31. 21 C 32. 36 20 12. 36 D 31. 15 20 11. 15 E 37. 32 22 15. 32 F 63. 48 25 38. 48 13. 79 23. 8 5 21. 3 5 6. 52 26. 1 6 1. 21 7. 09 84
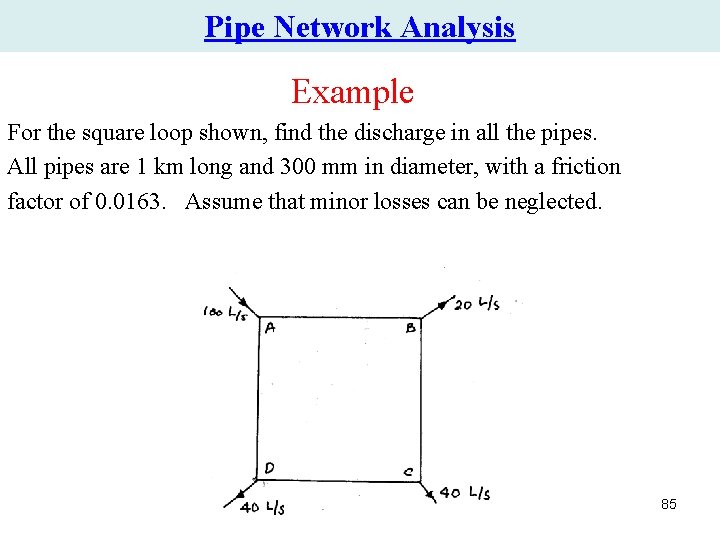
Pipe Network Analysis Example For the square loop shown, find the discharge in all the pipes. All pipes are 1 km long and 300 mm in diameter, with a friction factor of 0. 0163. Assume that minor losses can be neglected. 85
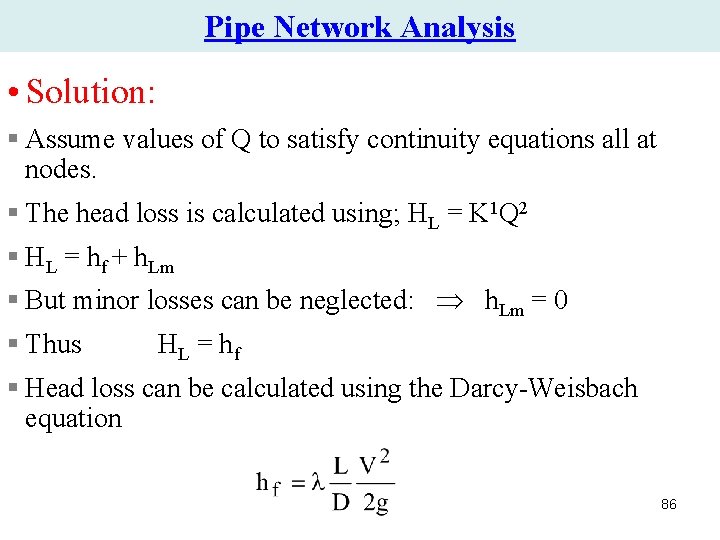
Pipe Network Analysis • Solution: § Assume values of Q to satisfy continuity equations all at nodes. § The head loss is calculated using; HL = K 1 Q 2 § HL = hf + h. Lm § But minor losses can be neglected: h. Lm = 0 § Thus HL = h f § Head loss can be calculated using the Darcy-Weisbach equation 86
Pipe Network Analysis First trial Pipe Q (L/s) HL (m) HL/Q AB 60 2. 0 0. 033 BC 40 0. 886 0. 0222 CD 0 0 0 AD -40 -0. 886 0. 0222 2. 00 0. 0774 Since HL > 0. 01 m, then correction has to be applied. 87
Pipe Network Analysis Second trial Pipe Q (L/s) HL (m) HL/Q AB 47. 08 1. 23 0. 0261 BC 27. 08 0. 407 0. 015 CD -12. 92 -0. 092 0. 007 AD -52. 92 -1. 555 0. 0294 -0. 0107 0. 07775 Since HL ≈ 0. 01 m, then it is OK. Thus, the discharge in each pipe is as follows (to the nearest integer). Pipe Discharge (L/s) AB 47 BC 27 CD -13 AD -53 88
http: //www. haestad. com/library/books/awdm/online/wwhelp/wwhimpl/java/html/wwhelp. htm 89