UNIT VII TOPOGRAPHIC MAPS After UNIT VII you


 where the")


- Slides: 24
UNIT VII: TOPOGRAPHIC MAPS
After UNIT VII you should be able to: q Interpret major topographical features such as hills, river valleys, and depressions q Accurately draw contour lines q Determine the direction a stream is flowing q Determine the contour interval on a map q Determine the gradient of a feature such as a hill or stream q Correctly draw a profile of a topographical feature q Determine the steepest side of a topographical feature such as a hill or lake q Determine the maximum altitude of a mountain or hill
What is a topographic map? § A topographic map mainly shows changes in elevation (height above or below sea level) and bodies of water § It offers a 1 -dimensional view of a 3 D landscape § Some advanced maps show additional features such as roads, buildings and many other items. These are typically identified in a key. § The map on page two of your notes shows the 7. 5 minute x 15 minute (1/8 o latitude x 1/4 o longitude) quadrangle featuring Upper Saranac Lake in the Adirondack Mountains. Note the scale and key on the right side of the map. § Maps like this are important to search and rescue teams as well as hikers
Revisiting a “Field” § Recall that a field is an area where measurements are taken § Measurements can be taken for a number of different variables but elevation is the measurement represented by contour lines on a topographic map. § Again, referring to the Upper Saranac Lake Map, you can see that the field (measureable area) is defined by lines of latitude and longitude. This is standard for topographic maps.
Drawing Contour Lines § Draw contour lines that connect elevations of equal value in the field § Lines are equal to an elevation which has units such as feet or meters
Contour Lines Rules § All points on the line are of equal value § So any point on the 500 ft. contour line will be equal to 500 ft. in elevation § For this reason, contour lines will never cross
Contour Lines Rules II § When drawing contour lines, they should be smooth § Contour lines should run off of a map if they need to, they are a part of a loop even if you see only part of it
Contour lines follow the same rules as any isoline. § If true, go through § Tip: Highlight or circle in pencil elevations that you know that value will go through before drawing the line
Draw the 50 foot and 100 foot contour lines § What is the value of the ocean shoreline?
Stream Flow § When you see V’s in a stream channel, the bend in the V points uphill § Therefore, the stream flows opposite (or out of) the V § Draw the 500, 520, 540, 560, 580, and 600 ft. contour lines, then determine stream flow using arrows.
What is a contour interval? § A contour interval is how much the elevation changes in between contour lines § Steps can be taken to determine what the interval is
Steps to determining contour intervals: § Determine the difference in value between 2 close index contours (lines that are labeled) § ______________
Steps to determining contour intervals § Determine the number of lines from one index contour line to the next 1 2 3 4 5 § ______________
Steps to determining contour intervals § Divide 580 560 540 520 100 ft. / 5 = 20 ft. Contour Interval
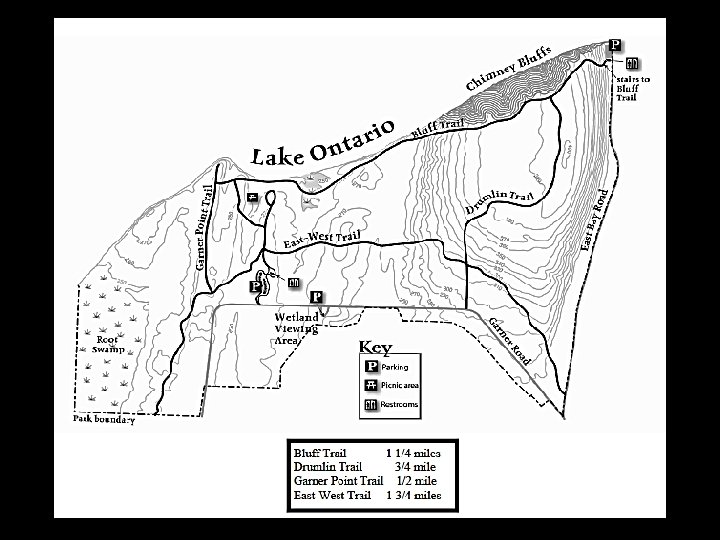
Trends in Contour Lines § We can expect a steeper gradient (slope) where the lines are closer together § This indicates a more rapid change in elevation. Consider the lines on the topographic map from Chimney Bluffs field trip. The first hill we climbed was quite steep, as were the bluffs themselves, both represented by very close contour lines in your note packet.
Additional Trends § Where lines close as a loop, a depression, lake or mountaintop can be found. To determine which of these you are looking at, examine the contour lines around the closed loop. Are they higher or lower? § If the lines decrease in value, you have a hill or mountaintop. If they increase you have a depression or lake. Again, looking at the Chimney Bluffs formation, we see closed loops at the summit of the drumlin.
What is the gradient on a topographic map? § Gradient = change in field value / distance § The gradient between two points describes the change in elevation over a distance § Another word for gradient is slope. Consider that the equation for gradient is very similar to that of slope in a mathematics course (rise/run).
Steps: 1. 2. 3. Determine the change in elevation between the two points (include units) Determine the distance between the two points (include units) Divide and include both sets of units. Determine the gradient between points X and Y on the map in your notes.
Determining Possible Elevations § Remember that each contour line is equal to a value, so any point in between contour lines must be between those two numbers § Mountaintops cannot exceed the next possible contour line elevation if that line does not exist. § What are possible elevations of point A in the map in your notes?
What is a profile? § A profile is the side image of a topographic feature
How do you create a profile? § Use a strip of paper to create tick marks on the contour lines (label elevation for each) § Use the tick marks to plot the points appropriately and connect with a smooth, arching line
Create a profile of Mount St. Helens
Create a profile of Lake Ontario