UNIT V POWER QUALITY MONITORING Dr A SHUNMUGALATHA


 • These may already be in place at many substations.")


 Temperature")


 • This is a typical case of tripping of Variable")


- Slides: 77
UNIT – V POWER QUALITY MONITORING Dr. A. SHUNMUGALATHA PROF. & HEAD / EEE VCET, MADURAI.
MONITORING CONSIDERATIONS • The monitoring objectives often determine the choice of monitoring equipment, triggering thresholds, methods for data acquisition and storage, and analysis and interpretation requirements. • Several common objectives of power quality monitoring are summarized here.
PQ MONITORING - INTRODUCTION • Power quality monitoring is the process of gathering, analyzing, and interpreting raw measurement data into useful information. • The process of gathering data is usually carried out by continuous measurement of voltage and current over an extended period. • The process of analysis and interpretation has been traditionally performed manually, but recent advances in signal processing and artificial intelligence fields have made it possible to design and implement intelligent systems to automatically analyze and interpret raw data into useful information with minimum human intervention.
NEED FOR PQ MONITORING • Power quality monitoring programs are often driven by the demand for improving the system wide power quality performance. • Many industrial and commercial customers have equipment that is sensitive to power disturbances, and, therefore, it is more important to understand the quality of power being provided. • Examples of these facilities include computer networking and telecommunication facilities, semiconductor and electronics manufacturing facilities, biotechnology and pharmaceutical laboratories, and financial data-processing centers. • Hence, in the last decade many utility companies have implemented extensive power quality monitoring programs.
SENSITIVE TO PQ DISTURBANCE Examples • Computer networking • Telecommunication facilities • Semiconductor and electronics manufacturing facilities • Biotechnology and pharmaceutical laboratories • Financial data-processing centers.
COMMON OBJECTIVES OF POWER QUALITY MONITORING Monitoring to characterize system performance • need to understand its system performance and then match that system performance with the needs of customers Monitoring to characterize specific problems • performing short-term monitoring at specific customer sites or at difficult loads. Monitoring as part of an enhanced power quality service • A provider and customer can together achieve this goal by modifying the power system or by installing equipment within the customer’s premises Monitoring as part of predictive or just-in-time • maintenance-Equipment maintenance can be quickly ordered to avoid catastrophic failure.
MONITORING TO CHARACTERIZE SYSTEM PERFORMANCE – This is the most general requirement. A power producer may find this objective important if it has the need to understand its system performance and then match that system performance with the needs of customers. – System characterization is a proactive approach to power quality monitoring. – By understanding the normal power quality performance of a system, a provider can quickly identify problems and can offer information to its customers to help them match their sensitive equipment’s characteristics with realistic power quality characteristics.
MONITORING TO CHARACTERIZE SPECIFIC PROBLEMS – Many power quality service departments or plant managers solve problems by performing short-term monitoring at specific customer sites or at difficult loads. – This is a reactive mode of power quality monitoring, but it frequently identifies the cause of equipment incompatibility, which is the first step to a solution.
MONITORING AS PART OF AN ENHANCED POWER QUALITY SERVICE – Many power producers are currently considering additional services to offer customers. One of these services would be to offer differentiated levels of power quality to match the needs of specific customers. – A provider and customer can together achieve this goal by modifying the power system or by installing equipment within the customer’s premises. In either case, monitoring becomes essential to establish the benchmarks for the differentiated service and to verify that the utility achieves contracted levels of power quality.
MONITORING AS PART OF PREDICTIVE OR JUST-IN-TIME MAINTENANCE – Power quality data gathered over time can be analyzed to provide information relating to specific equipment performance. – For example, a repetitive arcing fault from an underground cable may signify impending cable failure, or repetitive capacitor-switching restrikes may signify impending failure on the capacitor-switching device. – Equipment maintenance can be quickly ordered to avoid catastrophic failure, thus preventing major power quality disturbances which ultimately will impact overall power quality performance.
MONITORING AS PART OF A FACILITY SITE SURVEY • Site surveys are performed to evaluate concerns for power quality and equipment performance throughout a facility. • The survey will include inspection of wiring and grounding concerns, equipment connections, and the voltage and current characteristics throughout the facility. • Power quality monitoring, along with infrared scans and visual inspections, is an important part of the overall survey. • The initial site survey should be designed to obtain as much information as possible about the customer facility. This information is especially important when the monitoring objective is intended to address specific power quality problems.
This information is summarized here. 1. Nature of the problems (data loss, nuisance trips, component failures, control system malfunctions, etc. ) 2. Characteristics of the sensitive equipment experiencing problems (equipment design information or at least application guide information) 3. The times at which problems occur 4. Coincident problems or known operations (e. g. , capacitor switching) that occur at the same time 5. Possible sources of power quality variations within the facility (motor starting, capacitor switching, power electronic equipment operation, arcing equipment, etc. ) 6. Existing power conditioning equipment being used 7. Electrical system data (one-line diagrams, transformer sizes and impedances, load information, capacitor information, cable data, etc. )
POWER QUALITY MONITORING CONCEPT WITH MONITORING AT THE SUBSTATION AND SELECTED CUSTOMER LOCATIONS
CHOOSING MONITORING LOCATIONS • Since the primary objective was to characterize power quality on primary distribution feeders, monitoring was done on the actual feeder circuits. One monitor was located near the substation, and two additional sites were selected randomly. By randomly choosing • the remote sites, the overall project results represented power quality on distribution feeders in general. It may not be realistic, however, to assume that the three selected sites completely characterized power quality on the individual feeders involved
• When a monitoring project involves characterizing specific power quality problems that are actually being experienced by customers on the distribution system, the monitoring locations should be at actual customer service entrance locations because it includes the effect of step-down transformers supplying the customer. • Data collected at the service entrance can also characterize the customer load current variations and harmonic distortion levels. • Monitoring at customer service entrance locations has the additional advantage of reduced transducer costs. In addition, it provides indications of the origin of the disturbances, i. e. , the utility or the customer side of the meter.
• Another important aspect of the monitoring location when characterizing specific power quality problems is to locate the monitors as close as possible to the equipment affected by power quality variations. • It is important that the monitor sees the same variations that the sensitive equipment sees. High-frequency transients, in particular, can be significantly different if there is significant separation between the monitor and the affected equipment.
OPTIONS FOR PERMANENT POWER QUALITY MONITORING EQUIPMENT • Permanent power quality monitoring systems, should take advantage of the wide variety of equipment that may have the capability to record power quality information. • Some of the categories of equipment that can be incorporated into an overall monitoring system include the following:
Some of the categories of equipment that can be incorporated into an overall monitoring system • Digital fault recorders (DFRs). • Smart relays and other IEDs. • Voltage recorders. • In-plant power monitors. • Special-purpose power quality monitors. • Revenue meters
DIGITAL FAULT RECORDERS (DFRS) • These may already be in place at many substations. DFR manufacturers do not design the devices specifically for power quality monitoring. • However, a DFR will typically trigger on fault events and record the voltage and current waveforms that characterize the event. This makes them valuable for characterizing rms disturbances, such as voltage sags, during power system faults. DFRs also offer periodic waveform capture for calculating harmonic distortion levels.
SMART RELAYS AND OTHER IEDS • Many types of substation equipment may have the capability to be an intelligent electronic device (IED) with monitoring capability. Manufacturers of devices like relays and reclosers that monitor the current anyway are adding on the capability to record disturbances and make the information available to an overall monitoring system controller. • These devices can be located on the feeder circuits as well as at the substation.
VOLTAGE RECORDERS • Power providers use a variety of voltage recorders to monitor steady-state voltage variations on distribution systems. • We are encountering more and more sophisticated models fully capable of characterizing momentary voltage sags and even harmonic distortion levels. • Typically, the voltage recorder provides a trend that gives the maximum, minimum, and average voltage within a specified sampling window (for example, 2 s). • With this type of sampling, the recorder can characterize a voltage sag magnitude adequately. • However, it will not provide the duration with a resolution less than 2 s.
IN-PLANT POWER MONITORS • It is now common for monitoring systems in industrial facilities to have some power quality capabilities. • These monitors, particularly those located at the service entrance, can be used as part of a utility monitoring program. Capabilities usually include waveshape capture for evaluation of harmonic distortion levels, voltage profiles for steady-state rms variations, and triggered waveshape captures for voltage sag conditions. • It is not common for these instruments to have transient monitoring capabilities.
SPECIAL-PURPOSE POWER QUALITY MONITORS • The monitoring instrument developed for the EPRI DPQ project was specifically designed to measure the full range of power quality variations. This instrument features monitoring of voltage and current on all three phases plus the neutral. A 14 -bit analog-to-digital (A/D) board provides a sampling rate of 256 points per cycle for voltage and 128 points per cycle for current. • This high sampling rate allowed detection of voltage harmonics as high as the 100 th and current harmonics as high as the 50 th. • Most power quality instruments can record both triggered and sampled data. • Triggering should be based upon rms thresholds for rms variations and on waveshape for transient variations. Simultaneous voltage and current monitoring with triggering of all channels during a disturbance is an important capability for these instruments. • Power quality monitors have proven suitable for substations, feeder locations, and customer service entrance locations.
REVENUE METERS • Revenue meters monitor the voltage and current anyway, so it seems logical to offer alternatives for more advanced monitoring that could include recording of power quality information. • Virtually all the revenue meter manufacturers are moving in this direction, and the information from these meters can then be incorporated into an overall power quality monitoring system.
POWER QUALITY MEASUREMENT EQUIPMENT • It is clear that power quality phenomena cover a wide range of frequencies. They include everything from very fast transient overvoltages (microsecond time frame) to long-duration outages (hours or days time frame). • Power quality problems also include steady-state phenomena, such as harmonic distortion, and intermittent phenomena, such as voltage flicker.
TYPES OF INSTRUMENTS • • Wiring and grounding test devices Multimeters Oscilloscopes Disturbance analyzers Harmonic analyzers and spectrum analyzers Combination disturbance and harmonic analyzers Flicker meters Energy monitors
FACTORS TO BE CONSIDERED • • • Number of channels (voltage and/or current) Temperature specifications of the instrument Ruggedness of the instrument Input voltage range (e. g. , 0 to 600 V) Power requirements Ability to measure three-phase voltages Input isolation Ability to measure currents Housing of the instrument (portable, rack-mount, etc. ) Ease of use (user interface, graphics capability, etc. ) Documentation Communication capability (modem, network interface) Analysis software
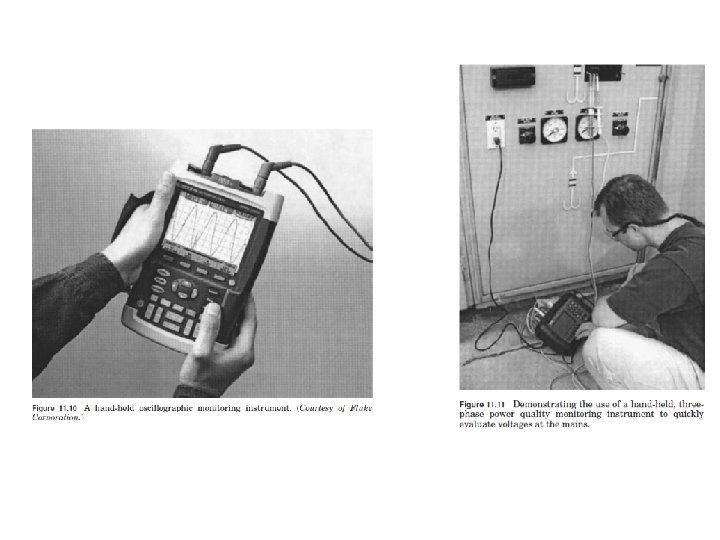
OSCILLOSCOPES • An oscilloscope is valuable when performing real-time tests. Looking at the voltage and current waveforms can provide much information about what is happening, even without performing detailed harmonic analysis on the waveforms. • One can get the magnitudes of the voltages and currents, look for obvious distortion, and detect any major variations in the signals.
• The latest developments in oscilloscopes are hand-held instruments with the capability to display waveforms as well as performing some signal processing. These are quite useful for power quality investigations because they are very portable and can be operated like a volt ohm meter (VOM), but yield much more information. • These are ideal for initial plant surveys. A typical device is shown in Figs. 11. 10 and 11. This particular instrument also has the capability to analyze harmonics and permits connection with personal computers for further data analysis and inclusion into reports as illustrated.
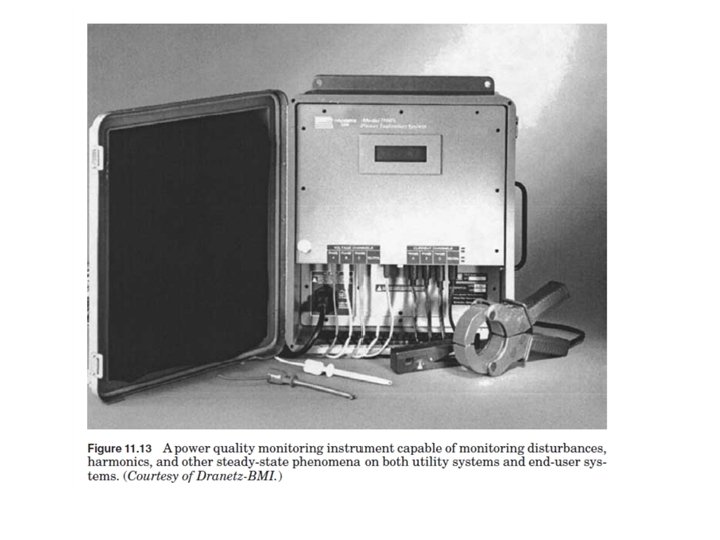
POWER LINE DISTURBANCE ANALYZER • The first generation of power quality monitors began in the mid-1970 s when Dranetz Engineering Laboratories (now Dranetz-BMI) introduced the Series 606 PLDA. • This was a microprocessor based monitor-analyzer first manufactured in 1975, and many units are still in service. • The output of these monitors was text-based, printed on a paper tape. • The printout described a disturbance by the event type (sag, interruption, etc. ) and voltage magnitude. • These monitors had limited functionalities compared to modern monitors, but the triggering mechanics were already well developed.
POWER LINE DISTURBANCE ANALYZER
• Second-generation power quality instruments debuted in the mid 1980 s. – featured full graphic display and digital memory to view and store captured power quality events, including both transients and steady-state events. • Some instruments had a capability of transmitting data from a remote monitoring site to a central location for further analysis. • Second-generation power quality instruments virtually had perfected the basic requirements of the triggering mechanism. Since the occurrence of a power quality disturbance is highly unpredictable, data must be continuously recorded and processed without any dead time
• Complex triggering engines determine what data and how much data should be saved to the digital memory. Trigger methods include fixed and floating limits and sensitivities, wave shape changes, and specific event characteristic parameters. These methods optimize the probability that what is important to the user will be captured and stored. • By the mid-1990 s, the third-generation power quality instruments emerged. The development of the third-generation power monitors was inspired in part by the EPRI DPQ project. • This generation of monitors was more appropriate as part of a complete power quality monitoring system, and the software systems to collect and manage the data were also developed. • Since the conclusion of the project, substantial field experience gained revealed some of the difficulties in managing a large system of power quality monitors
DISTURBANCE ANALYZERS • Disturbance analyzers and disturbance monitors form a category of instruments that have been developed specifically for power quality measurements. • They typically can measure a wide variety of system disturbances from very short duration transient voltages to long-duration outages or undervoltages. Thresholds can be set and the instruments left unattended to record disturbances over a period of time. • The information is most commonly recorded on a paper tape, but many devices have attachments so that it can be recorded on disk as well.
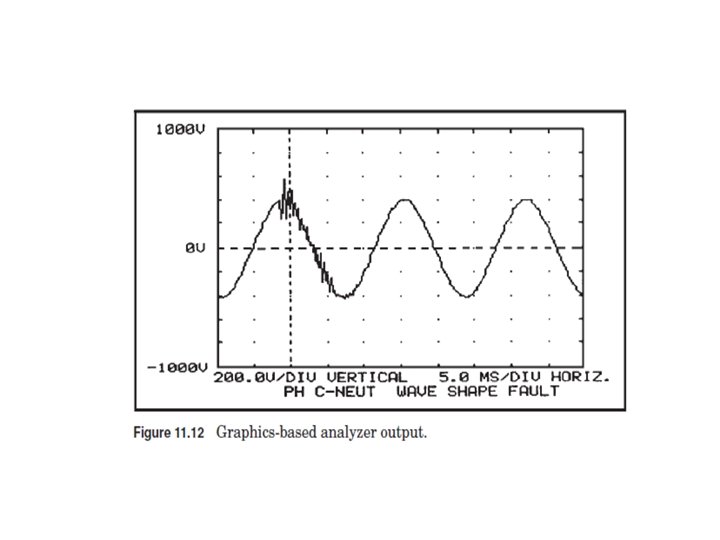
• There are basically two categories of these devices: 1. Conventional analyzers that summarize events with specific information such as overvoltage and undervoltage magnitudes, sags and surge magnitude and duration, transient magnitude and duration, etc. 2. Graphics-based analyzers that save and print the actual waveform along with the descriptive information which would be generated by one of the conventional analyzers
• It is often difficult to determine the characteristics of a disturbance or a transient from the summary information available from conventional disturbance analyzers. For instance, an oscillatory transient cannot be effectively described by a peak and a duration. • Therefore, it is almost imperative to have the waveform capture capability of a graphics-based disturbance analyzer for detailed analysis of a power quality problem (Fig. 11. 12). • However, a simple conventional disturbance monitor can be valuable for initial checks at a problem location.
SPECTRUM ANALYZERS AND HARMONIC ANALYZERS • Instruments in the disturbance analyzer category have very limited harmonic analysis capabilities. Some of the more powerful analyzers have add-on modules that can be used for computing fast Fourier transform (FFT) calculations to determine the lower-order harmonics. • However, any significant harmonic measurement requirements will demand an instrument that is designed for spectral analysis or harmonic analysis. Important capabilities for useful harmonic measurements include – Capability to measure both voltage and current simultaneously so that harmonic power flow information can be obtained.
– Capability to measure both magnitude and phase angle of individual harmonic components (also needed for power flow calculations). – Synchronization and a sampling rate fast enough to obtain accurate measurement of harmonic components up to at least the 37 th harmonic (this requirement is a combination of a high sampling rate and a sampling interval based on the 60 -Hz fundamental). – Capability to characterize the statistical nature of harmonic distortion levels (harmonics levels change with changing load conditions and changing system conditions).
CATEGORIES OF INSTRUMENTS TO CONSIDER FOR HARMONIC ANALYSIS • Simple meters. – It may sometimes be necessary to make a quick check of harmonic levels at a problem location. A simple, portable meter for this purpose is ideal. – There are now several hand-held instruments of this type on the market. Each instrument has advantages and disadvantages in its operation and design. – These devices generally use microprocessor-based circuitry to perform the necessary calculations to determine individual harmonics up to the 50 th harmonic, as well as the rms, the THD, and the telephone influence factor (TIF). – Some of these devices can calculate harmonic powers (magnitudes and angles) and can upload stored waveforms and calculated data to a personal computer.
• General-purpose spectrum analyzers. – Instruments in this category are designed to perform spectrum analysis on waveforms for a wide variety of applications. They are general signal analysis instruments. – The advantage of these instruments is that they have very powerful capabilities for a reasonable price since they are designed for a broader market than just power system applications. – The disadvantage is that they are not designed specifically for sampling power frequency waveforms and, therefore, must be used carefully to assure accurate harmonic analysis. There a wide variety of instruments in this category.
• Special-purpose power system harmonic analyzers. – Besides the general-purpose spectrum analyzers just described, there also a number of instruments and devices that have been designed specifically for power system harmonic analysis. – These are based on the FFT with sampling rates specifically designed for determining harmonic components in power signals. They can generally be left in the field and include communications capability for remote monitoring.
FLICKER METERS • Over the years, many different methods for measuring flicker have been developed. These methods range from using very simple rms meters with flicker curves to elaborate flicker meters that use exactly tuned filters and statistical analysis to evaluate the level of voltage flicker. • This section discusses various methods available for measuring flicker. • Flicker standards. Although the United States does not currently have a standard for flicker measurement, there are IEEE standards that address flicker. IEEE Standards 14119936 and 519 -19927 both contain flicker curves that have been used as guides for utilities to evaluate the severity of flicker within their system.
• Both flicker curves, from Standards 141 and 519, are shown in Fig. 11. 16. • In other countries, a standard methodology for measuring flicker has been established. The IEC flicker meter is the standard for measuring flicker in Europe and other countries currently adopting IEC standards. • The IEC method for flicker measurement, defined in IEC Standard 61000 -4 -158 (formerly IEC 868), is a very comprehensive approach to flicker measurement and is further described in “Flicker Measurement Techniques” below. • More recently, the IEEE has been working toward adoption of the IEC flicker monitoring standards with an additional curve to account for the differences between 230 -V and 120 -V systems.
FLICKER MEASUREMENT TECHNIQUES • RMS strip charts. – Historically, flicker has been measured using rms meters, load duty cycle, and a flicker curve. If sudden rms voltage deviations occurred with specified frequencies exceeding values found in flicker curves, such as one shown in Fig. 11. 16, the system was said to have experienced flicker. • A sample graph of rms voltage variations is shown in Fig. 11. 17 where large voltage deviations up to 9. 0 V rms (V/V ― 8. 0 percent on a 120 -V base) are found. Upon comparing this to the flicker curve in Fig. 11. 16, the feeder would be experiencing flicker, regardless of the duty cycle of the load producing the flicker, becauseany sudden total change in voltage greater than 7. 0 V rms results in objectionable flicker, regardless of the frequency. • The advantage to such a method is that it is quite simple in nature and the rms data required are rather easy to acquire. The apparent disadvantage to such a method would be the lack of accuracy and inability to obtain the exact frequency content of the flicker.
FAST FOURIER TRANSFORM • Another method that has been used to measure flicker is to take raw samples of the actual voltage waveforms and implement a fast Fourier transform on the demodulated signal (flicker signal only) to extract the various frequencies and magnitudes found in the data. • These data would then be compared to a flicker curve. Although similar to using the rms strip charts, this method more accurately quantifies the data measured due to the magnitude and frequency of the flicker being known. • The downside to implementing this method is associated with quantifying flicker levels when the flicker-producing load contains multiple flicker signals. Some instruments compensate for this by reporting only the dominant frequency and discarding the rest.
FLICKER METERS • Because of the complexity of quantifying flicker levels that are based upon human perception, the most comprehensive approach to measuring flicker is to use flicker meters. • A flicker meter is essentially a device that demodulates the flicker signal, weights it according to established “flicker curves, ” and performs statistical analysis on the processed data. • Generally, these meters can be divided up into three sections. In the first section the input waveform is demodulated, thus removing the carrier signal. • As a result of the demodulator, a dc offset and higherfrequency terms (sidebands) are produced. The second section removes these unwanted terms using filters, thus leaving only the modulating (flicker) signal remaining.
• The second section also consists of filters that weight the modulating signal according to the particular meter specifications. • The last section usually consists of a statistical analysis of the measured flicker. • The most established method for doing this is described in IEC Standard 61000 -4 -15. 8 The IEC flicker meter consists of five blocks, which are shown in Fig. 11. 18. • Block 1 is an input voltage adapter that scales the input halfcycle rms value to an internal reference level. This allows flicker measurements to be made based upon a percent ratio rather than be dependent upon the input carrier voltage level.
• Block 2 is simply a squaring demodulator that squares the input to separate the voltage fluctuation (modulating signal) from the main voltage signal (carrier signal), thus simulating the behavior of the incandescent lamp. • Block 3 consists of multiple filters that serve to filter out unwanted frequencies produced from the demodulator and also to weight the input signal according to the incandescent lamp eye-brain response.
The basic transfer function for the weighting filter is
• The basic transfer function for the weighting filter is
• Block 4 consists of a squaring multiplier and sliding mean filter. The voltage signal is squared to simulate the nonlinear eye-brain response, while the sliding mean filter averages the signal to simulate the short term storage effect of the brain. The output of this block is considered to be the instantaneous flicker level. A level of 1 on the output of this block corresponds to perceptible flicker. • Block 5 consists of a statistical analysis of the instantaneous flicker level. The output of block 4 is divided into suitable classes, thus creating a histogram. • A probability density function is created based upon each class, and from this a cumulative distribution function can be formed.
• Flicker level evaluation can be divided into two categories, short term and long-term. Short-term evaluation of flicker severity PST is based upon an observation period of 10 min. This period is based upon assessing disturbances with a short duty cycle or those that produce continuous fluctuations. • PST can be found using the equation where the percentages P 0. 1, P 1 s, P 3 s, P 10 s, and P 50 s are the flicker levels that are exceeded 0. 1, 1. 0, 3. 0, 10. 0, and 50. 0 percent of the time, respectively. These values are taken from the cumulative distribution curve discussed previously. A PST of 1. 0 on the output of block 5 represents the objectionable (or irritable) limit of flicker.
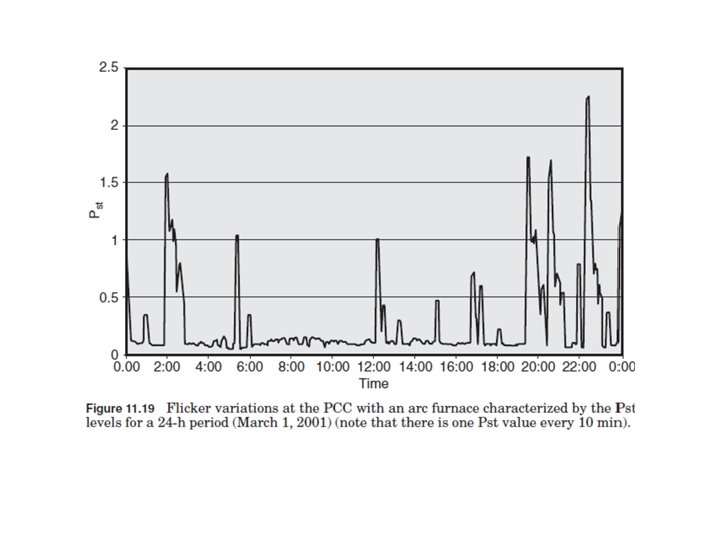
• For cases where the duty cycle is long or variable, such as in arc furnaces, or disturbances on the system that are caused by multiple loads operating simultaneously, the need for the longterm assessment of flicker severity arises. • Therefore, the long-term flicker severity PLT is derived from PST using the equation • where N is the number of PST readings and is determined by the duty cycle of the flicker-producing load. The purpose is to capture one duty cycle of the fluctuating load. If the duty cycle is unknown, the recommended number of PST readings is 12 (2 -h measurement window).
• The advantage of using a single quantity, like Pst, to characterize flicker is that it provides a basis for implementing contracts and describing flicker levels in a much simpler manner. • Figure 11. 19 illustrates the Pst levels measured at the PCC with an arc furnace over a 24 -h period. The melt cycles when the furnace was operating can be clearly identified by the high Pst levels. Note that Pst levels greater than 1. 0 are usually considered to be levels that might result in customers being aware of lights flickering.
Expert Systems in Power Quality Monitoring
Applications of Expert systems in Power Quality Monitoring • Voltage sag direction module • Radial fault locator module. • Capacitor-switching operation inspection module. • Lightning correlation module.
CASE STUDY ON POWER QUALITY MONITORING
Storage Solutions for Power Quality Issues and Renewable Energy A. D. Thirumoorthy Energy Consultant, Kashyap Consultancy Services Advisor-APQI Member, State Working Group for RE, Govt. of TN
Asia Power Quality Initiative • Program initiated in Asia with the background of the European Experiment (LPQI) – Continuing Professional Development • A neutral collaborative platform shared by National Support Network (NSN) Partners to promote education and awareness and facilitate policy changes. Objective: – help industries in Asia address Power Quality issues as a means to enhance their competitiveness in terms of better production output quality, reduced production costs, reduced production line interruption and batch losses. • – Building up capacity of industry / service sector in identifying and addressing PQ issues as a means to enhance their continuous quality delivery – Facilitate policy changes and market transformation towards ‘Safe and Quality Power for All’. 64
STORAGE SOLUTION AND POWER QUALITY
Power Quality Parameters Frequency Voltage Variations Voltage Flicker Voltage Dip
Contd. Interruptions Temporary Overvoltage Transients
Contd. Unbalance Harmonics Interharmonics
Energy Storage for Power Quality Issues • Most of the power quality issues cause tripping of machines, leading to production loss • Most of the companies operate using a DG to avoid these issues • Storage solution would be optimum to overcome these issues
Case Studies (Voltage Sag) • This is a typical case of tripping of Variable Drives due to Voltage Sag experienced by a Textile Mill at Coimbatore • Voltage Sag caused in the Feeder due to fault tripping of another feeder in the same Sub Station • Voltage Sag magnitude is dependant on the strength of the Grid where the load is incident • Duration of Voltage Sag is dependant on the duration of the equipment isolating the fault from the Grid
Voltage Sag 39%
Tripping of Drives Due to Voltage Sag -38%
Case Study in Wire Manufacturing • • • • Manufacturing - 1000 m single length required without joint DG used because of frequent power interruption Monthly consumption – 1, 96, 000 Units 380 k. VA DG is used for 24 hoursx 6 days Cost of energy from DG– Rs 22/Unit Energy Cost from DG– Rs 22 x 1, 96, 000 – Rs 43, 12, 000 400 k. VA online UPS for 15 minutes introduced (Based on power interruption data) Cost of UPS and other associated works– Rs 38, 000 Cost of Energy from EB – Rs 6. 9/Unit (Average) Total cost of energy from EB – 6. 9 x 1, 96, 000 – Rs 13, 52, 000 Additional demand charges @Rs 350/k. VA/Month – 350 x 400 -Rs 1, 40, 000 Difference in cost of energy – Rs 43, 12, 000 -Rs 13, 52, 000 -1, 40, 000 – Rs 28, 20, 000 Payback Period – 38, 000/28, 20, 000 – 1 year and 4 months
Power Quality Issue in Flour Mill, TN Contract Demand – 700 k. VA Critical load – 400 k. VA Average Monthly Consumption– 2, 67, 000 Units Average Monthly Power outage- 29 Hrs. Average Number of times power outage per month - 41 Times 750 k. VA Diesel Generator Usage – 9 Hrs to 40 Hrs per month depending on meeting production demand • Average Production loss per month because of power outage – 242 MT • • •
Energy Storage for RE • Tamil Nadu: Wind Mill 8255 MW, Solar 2141 MW • To achieve comfortable ramp up power to maintain grid frequency, energy storage will be the best alternative solution. • CEA Dec 2017 report recommends for 20 MW pilot energy storage @ wind rich state of Tamilnadu for balancing variable RE power. 12/3/2020 75
Advantages of Energy Storage Better grid management Active Power Control Reactive Power control Reactive Power Management Energy generation from Windmills possible even during Grid Back down or grid outage • Power Quality Mitigation • Better Power Quality • • •
Thirumoorthy A D <adtmoorthy@gmail. com>