Unit One Basic Economic Concepts Economics Defined Economics

Unit One Basic Economic Concepts

Economics Defined Economics- Social Science concerned with the efficient use of scarce resources to achieve maximum satisfaction of economic wants and needs.
 Studies a single entity in an economy. Example- An Individual or Company")
Microeconomics- (Small) Studies a single entity in an economy. Example- An Individual or Company (like studying just Google) Macroeconomics- (Large) The big picture of an economy Example: U. S. unemployment rate or GDP Macro Micro

Resources • Any item that helps produce goods and services. • Almost anything we could name is a resource.

Land

Labor Any human effort used in producing a product or service.

Capital Human made resources used to produce goods and services. Do not directly satisfy human wants.

Entrepreneurship-To develop a new combination of resources to produce something of value. The idea person.

Entrepreneurship • The risk taking idea person.

Factors of Production • Land, labor, capital, entrepreneurship

What is Basic Economic Problem? • All Resources are LIMITED. • All wants are INSATIABLE. – (Not able to be satisfied)

What is Basic Economic Problem? • All Resources are LIMITED. • All wants are INSATIABLE. – (Not able to be satisfied)

TRADEOFFS • Tradeoffs: Giving up one thing to have another. • Every decision you make involves a tradeoff. – You can’t have it all.

Opportunity Costs • Opportunity Costs: The cost/value of a tradeoff. – Value of the next best alternative sacrificed to obtain desired item. (Or the value of what else you could have done. )

Production Possibility Curve • Illustrates opportunity cost, scarcity, and efficiency. • Shows options for an individual.

Production Possibility Curves • Illustrates opportunity cost, scarcity, and efficiency. • Measures society’s maximum output given amount of limited resources. • Compares two types of products. (Consumer Vs. Capital) OR Consumer Goods Capital Goods

WE HAVE A PROBLEM!! The Economizing Problem… Scarcity Society has unlimited wants but limited resources 17
 Using Economic Models… Step 1: Explain concept in words")
The Production Possibilities Curve (PPC) Using Economic Models… Step 1: Explain concept in words Step 2: Use numbers as examples Step 3: Generate graphs from numbers Step 4: Make generalizations using graph 18
 is a")
What is the Production Possibilities Curve? • A production possibilities graph (PPG) is a model that shows alternative ways that an economy can use its scarce resources • This model graphically demonstrates scarcity, trade-offs, opportunity costs, and efficiency. • • 4 Key Assumptions Only two goods can be produced Full employment of resources Fixed Resources (Ceteris Paribus) Fixed Technology 19

Production “Possibilities” Table Bikes Computers A 14 0 B 12 2 C 9 4 D 5 6 E 0 8 f 0 10 Each point represents a specific combination of goods that can be produced given full employment of resources. NOW GRAPH IT: Put bikes on y-axis and computers on x-axis 20

Production Possibilities How does the PPG graphically demonstrates scarcity, trade-offs, opportunity costs, and efficiency? Impossible/Unattainable 14 (given current resources) A B Bikes 12 G C 10 8 Efficient D 6 Inefficient/ Unemployment 4 2 E 0 0 2 4 6 8 10 Computers 21

Opportunity Cost Example: 1. The opportunity cost of moving from a to b is… 2 Bikes 2. The opportunity cost of moving from b to d is… 7 Bikes 3. The opportunity cost of moving from d to b is… 4 Comps 4. The opportunity cost of moving from f to c is… 0 Computers 5. What can you say about point G? Unattainable 22

Constant vs. Increasing Opportunity Cost Identify which product would have a straight line PPC and which would be bowed out? Corn Cactus Wheat Pineapples

Shifting PPCs Shift to right is expansion Shift to left is contraction

Causes of PPC Expansionary Shifts 1. Population Growth 2. Technology Advancement 3. Development of existing Resources 4. Discovery of more Natural Resources. 5. Increased Educational Levels 6. Improved Health and Medical care 7. Increases in Trade Relations
 26")
The Production Possibilities Curve (or Frontier) 26

Production Possibilities CALZONES PIZZA A B C D E 4 0 3 1 2 2 1 3 0 4 • List the Opportunity Cost of moving from a-b, b-c, c-d, and d-e. • Constant Opportunity Cost- Resources are easily adaptable for producing either good. • Result is a straight line PPC (not common) 27

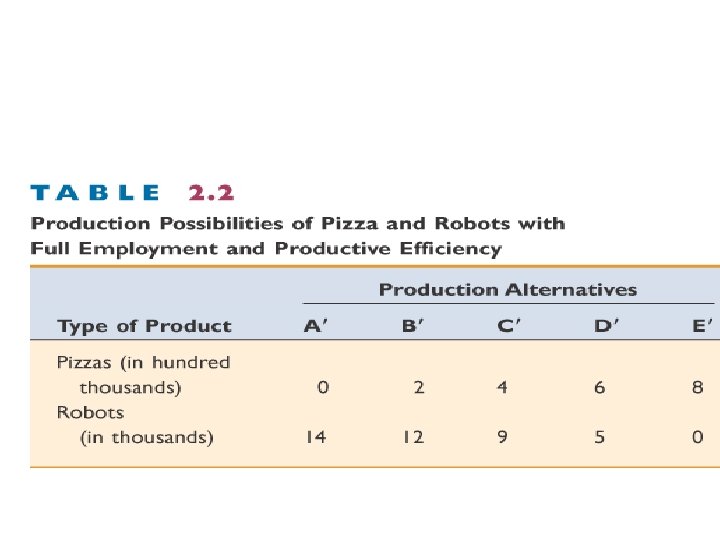
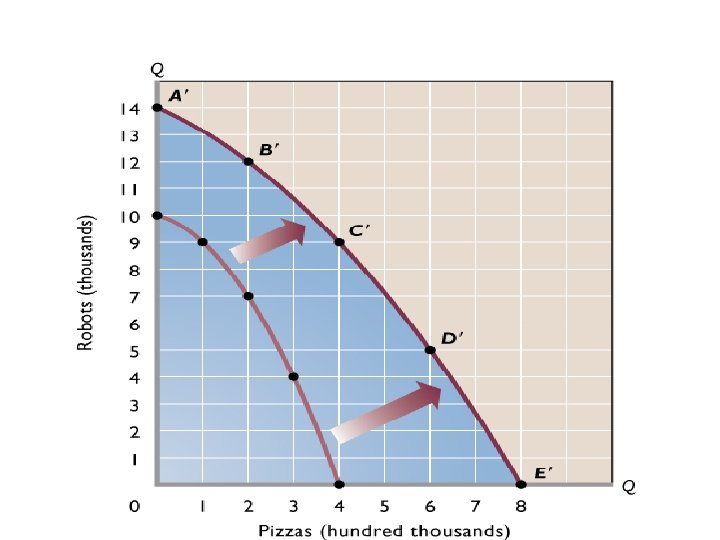
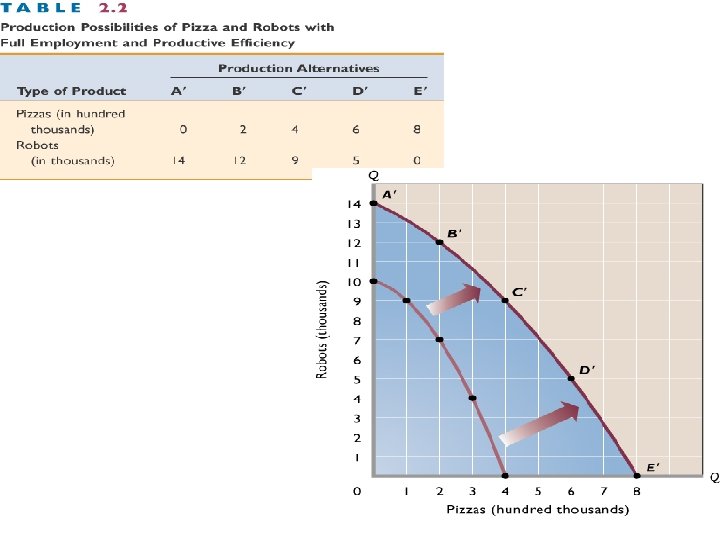
Production Possibilities PIZZA ROBOTS A 20 0 B 19 1 C 16 2 D 10 3 E 0 4 • List the Opportunity Cost of moving from a-b, b-c, c-d, and d-e. • Law of Increasing Opportunity Cost • As you produce more of any good, the opportunity cost (forgone production of another good) will increase. • Why? Resources are NOT easily adaptable to producing both goods. • Result is a bowed out (Concave) PPC

PER UNIT Opportunity Cost How much each marginal = Opportunity Cost unit costs Units Gained Example: 1. The PER UNIT opportunity cost of moving from a to b is… 1 Bike 2. The PER UNIT opportunity cost of moving from b to c is… 1. 5 (3/2) Bikes 3. The PER UNIT opportunity cost of moving from c to d is… 2 Bikes 4. The PER UNIT opportunity cost of moving from d to e is… 2. 5 (5/2) Bikes NOTICE: Increasing Opportunity Costs 29

Capital Goods Consumer Goods

Capital Consumer Goods

Utility Maximization • Utility: Pleasure, happiness, or satisfaction. • Make decisions to get the most satisfaction.

MARGINAL • In Economics, we define the word Marginal as extra, added, or next. • Marginal Benefit: what is the extra positive outcome (benefit) from a decision. – Benefit (utils)starts out high. Then drops as more is consumed. • Law of Diminishing Marginal Utility

MARGINAL • Marginal Cost: what is the extra cost of a decision. – Starts out low and increases as more is consumed. • Law of Increasing Costs
")
5 10 15 (slices)

• MB = MC is optimal.

Benefit/Cost • MB = MC is optimal. 5 10 15

60% of jobs could be held by unskilled semi-skilled workers. Today, it is only 15%. In 1960, or “The high school graduate of today has about the same impact on the job market as the 8 th grade graduate of 30 years ago. ” The world into which you graduate will require far greater conceptual skills than was required of your parents and grandparents. Productive and satisfying manual labor that engaged previous generations will become increasingly less available as technology substitutes for so many of those earlier skills. Your future incomes will depend on your conceptual abilities. Alan Greenspan Just as important, because the complexity of our economic system continues to increase, the skill level that you reach in your twenties will surely be inadequate for the needs of our economy when you reach forty. So education must be ongoing. A. Greenspan

Costs of Unemployment • Unequal Burdens based on skills and age: • Age: Teens have higher rates of unemployment. (Lower skills, quit, fired, less mobility. ) • Occupations: Lower skilled jobs have higher unemployment rates. – Lower skilled workers have longer duration unemployment.

Costs of Unemployment • Race: Blacks and Hispanics have higher unemployment rates. • Gender: U/E Rate for men and women is about the same. • Education: Less education = less jobs • Duration: 15 weeks

Costs of Unemployment • Social Costs: Depression, suicide, loss of morale, crime, skill loss, political unrest, heart attacks, strokes, mental illness, divorce, family problems. • HAVE A NICE DAY
- Slides: 44