UNIT 6 TEST REVIEW DESCRIBING DATA MR PERK

UNIT 6 TEST REVIEW DESCRIBING DATA

MR. PERK INS WANT S TO COMPARE THE NU MB ER O F GO LF PLAYERS ON HIS COURSE ON A W EEK DAY VERS US A WEEKEND. HE RE CO RDS THE NU MB ER O F GO LFE RS E VE RY HOUR ON A RANDOMLY CHOSEN W EEK DAY, A ND AGAIN ON A R AND OMLY CHOS EN W EEKE ND. WHI CH MEASU RE S S HOU LD BE US ED TO CO MPARE THE NUMBER OF GOLFERS ON THE COURS E ON A WEEKDA Y AND A WEEKEN D?

SARAH AND KIMA ARE STUDENTS IN MS. SCHMITT'S ALGEBRA CLASS. OVER THE COURSE OF THE SEMESTER, THEY EACH TOOK 16 QUIZZES. THEIR SCORES ON EACH QUIZ ARE LISTED BELOW. WHAT IS THE DIFFERENCE BETWEEN THE INTERQUARTILE RANGE OF SARAH'S QUIZ SCORES AND THE INTERQUARTILE RANGE OF KIMA'S QUIZ SCORES? • Sarah: 80, 84, 86, 88, 90, 90, 95, 100, 100 • Kima: 70, 82, 85, 85, 88, 90, 92, 95, 100, 100

THE DEMOGRAPHIC DATA BELOW WAS COLLECTED ONE AFTERNOON AT SELHURST MALL. WHICH MEASURES SHOULD BE USED TO COMPARE THE AGES OF PATRONS USING THE EAST AND SOUTH EXITS?

TWO SETS OF DATA ARE REPRESENTED BY THE BOX-AND-WHISKER PLOTS BELOW. SELECT ALL OF THE FOLLOWING STATEMENTS ABOUT THESE DATA SETS THAT ARE TRUE. A. The data sets have the same interquartile range but different ranges. B. The data sets have the same mean but different medians. C. The data sets have the same median but different means. D. Since Data Set 1 is skewed left, the mean is less than the median.

WHAT IS THE ESTIMATED R OR CORRELATION COEFFICIENT

THE MARKETING DIVISION OF AN ELECTRONICS COMPANY IS ANALYZING THE RELATIONSHIP BETWEEN THE AMOUNT THEY SPENT ADVERTISING A PRODUCT AND THE NUMBER OF UNITS OF THE PRODUCT SOLD. THEY ANALYZED MONTHLY DATA FROM THE PAST SIX MONTHS. THE DATA THEY ANALYZED ARE SHOWN BELOW. Advertising Expense (thousands of dollars) Units of Product Sold • A. As the amount spent on advertising a product increases, the number of units of the product • sold also increases. 5. 2 20, 000 6. 1 22, 500 6. 4 23, 200 7. 1 25, 600 • C. A linear model can be used to represent the relationship between the amount spent on 9. 4 28, 100 • advertising and the number of units of the product sold. 10. 2 29, 000 • B. There is a positive association between the amount spent on advertising and the number • of units of the product sold. • D. The slope of a line that models the relationship between the amount spent on advertising • and the number of units of the product sold is.

DATA VALUES FOR TWO VARIABLES, AND , ARE COLLECTED. THE LINEAR CORRELATION COEFFICIENT FOR THE DATA IS COMPUTED TO BE. WHAT DOES THIS VALUE OF INDICATE?

THE TABLE AND SCATTER PLOT BELOW SHOW THE NUMBER OF PUBLIC SCHOOLS IN THE UNITED STATES FROM 2000 TO 2009. WHAT KIND OF RELATIONSHIP APPEARS TO EXIST BETWEEN THE YEAR AND THE NUMBER OF PUBLIC SCHOOLS IN THE UNITED STATES? PROVIDE A FUNCTION THAT MODELS THIS RELATIONSHIP.

BELOW ARE THREE STUDENTS' SCIENCE QUIZ SCORES FROM A SEMESTER. WHICH OF THE FOLLOWING STATEMENTS IS TRUE? A. Kyle's mean score is less than his median score. B. Alexis's median score is less than her mean score. C. Jess has the lowest mean score and highest standard deviation. D. Alexis has the highest mean score and highest standard deviation.

DIRECTIONS: THE TWO SCATTER PLOTS BELOW COMPARE THE WIN TOTALS OF ALL 32 NATIONAL FOOTBALL LEAGUE (NFL) TEAMS TO THEIR TOTAL YARDS OF OFFENSE AND THEIR TURNOVER DIFFERENTIAL FOR THE PAST SEASON. A LINE OF BEST FIT IS DRAWN ON EACH SCATTER PLOT. USE THE INFORMATION FROM THESE SCATTER PLOTS TO ANSWER THE QUESTIONS THAT FOLLOW.
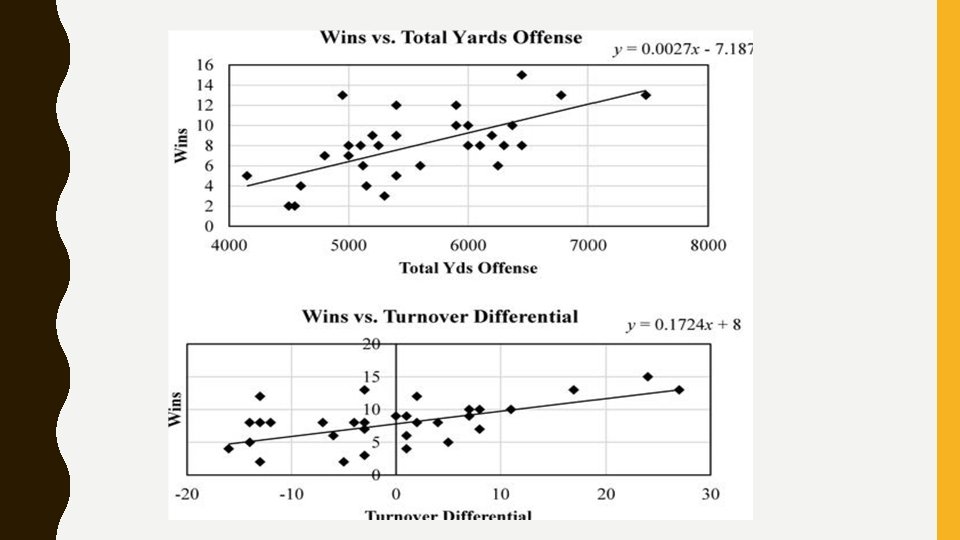

WHAT IS A CORRECT INTERPRETATION OF THE SLOPE FOR THE LINE OF BEST FIT ON THE WINS VS. TOTAL YARDS OF OFFENSE SCATTER PLOT? • A. The average team gained 270 yards of offense in each win last season. • B. For every 2, 700 more total yards of offense a team had, it correlated to 1 more win in the • season. • C. The average team won about 7. 2 games last season. • D. For every 1, 000 more total yards of offense a team had, it correlated to 2. 7 more wins in • the season.

MARTINA COLLECTED DATA ON THE MAXIMUM SPEED OF SEVERAL DIFFERENT TYPES OF SNAKES. THE AVERAGE WEIGHT (IN OUNCES) FOR EACH TYPE OF SNAKE AND THE AVERAGE MAXIMUM SPEED (IN FEET PER SECOND) IS SHOWN BELOW. MARTINA CONCLUDED THAT BEING HEAVY CAUSES SNAKES TO BE SLOWER. WHAT IS WRONG WITH MARTINA'S REASONING?

• A. There is no correlation between the speed and weight of a snake, so this is evidence that • being heavy does not cause a snake to be slower. • B. There is no correlation between the speed and weight of a snake, so there is no evidence • that being heavy causes a snake to be slower. • C. There is a negative linear correlation between the speed of a snake and its weight, so • instead it is the slow speed of a snake that causes it to be heavy. • D. There is a negative linear correlation between the speed and weight of a snake, but this is
- Slides: 15