UNIT 4 POPULATION Population World Patterns Regional Trends


 • Average number of children that would be born to")
")
 • Annual number of deaths per 1000 population •")


")


 In which box are the dots")


- Slides: 54
UNIT 4: POPULATION Population: World Patterns, Regional Trends
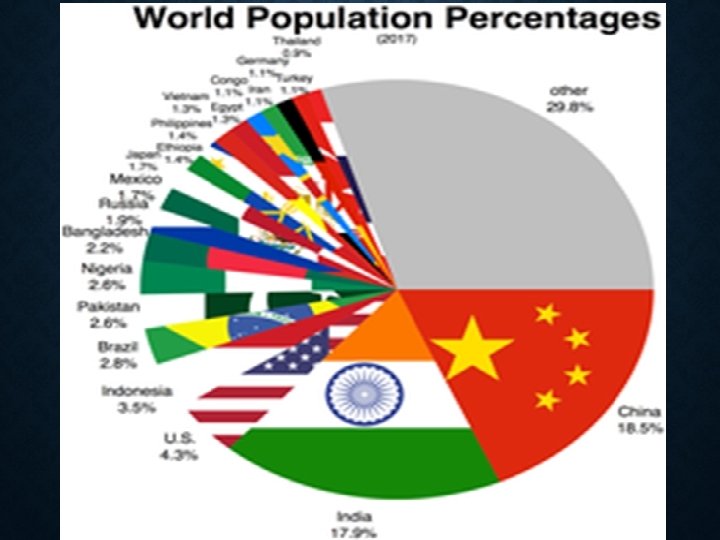
WHAT ARE WE GOING TO TALK ABOUT? • Distribution of World Population • Population Statistics/Characteristics • Population Pyramids • Demographic Transition Model • Population Control • Overpopulation (Malthus and Neo-Malthusians
POPULATION: • all the inhabitants of a particular town, area, or country.
WHAT IS DEMOGRAPHY • Statistical study of human population • Includes: • Births • Deaths • Income • Disease • ALL illustrate the changing structure of human populations.
GEOGRAPHIC ANALYSIS… DO NOT WRITE • Regional considerations include: • Resources • Type of economic development • Level of living • Food supply • Conditions of health & well-being • We saw this is Aftermath: Population Zero!
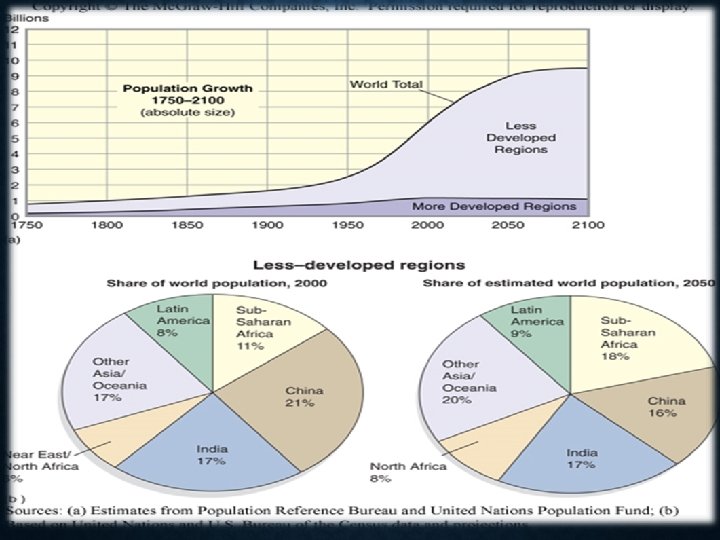
WHY IS POPULATION IMPORTANT? • Population Geography helps us predict the future! • 12, 000 years ago = 5 to 10 million • 2006 = over 6. 5 billion humans • UN projection for 2050 = 9. 1 billion
POPULATION GROWTH/DECLINE • Births must exceed deaths for growth!
POPULATION DENSITY • The relationship between number of inhabitants and the areas they occupy
World Population Density
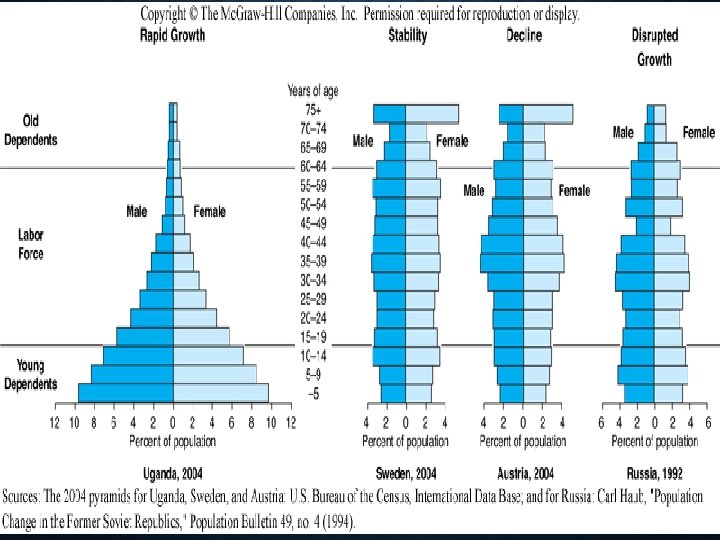
POPULATION PYRAMIDS • Population composition by age & sex • During 1800 s populations: pyramid shape • Reflects major population impacts
STUDY FOR YOUR MAP QUIZ • Argentina • French Guiana • Bolivia • Guyana • Brazil • Paraguay • Chile • Peru • Colombia • Suriname • Ecuador • Uruguay • Venezuela
THREE MEASURES OF CHANGE • 1. Fertility rates • Crude birth rate • Total fertility rate • 2. Mortality rates • Crude death rate • Infant mortality rate • 3. Migration
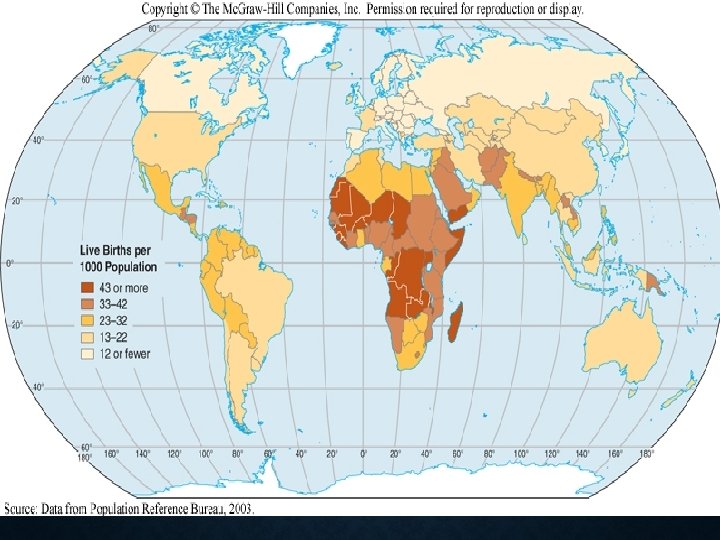
CRUDE BIRTH RATE • Annual number of live births per 1000 population • Considered ‘high’ – 30 > per 1000 • Considered ‘low’ – 18 < per 1000
TOTAL FERTILITY RATE (TFR) • Average number of children that would be born to each woman • Childbearing ages: 15 to 45
Total fertility rate (TFR)
CRUDE DEATH RATE (MORTALITY RATE) • Annual number of deaths per 1000 population • ‘high’ = > 20 per 1000 • ‘low’ = <10 per 1000
ARE PEOPLE DYING LIKE THEY USED TO? • Civil War: • 620, 000 Americans • World War I: • 116, 000 Americans • World War II: • 416, 000 Americans • Post WWII: • antibiotics, immunization, pesticides, sanitation, safe water supplies
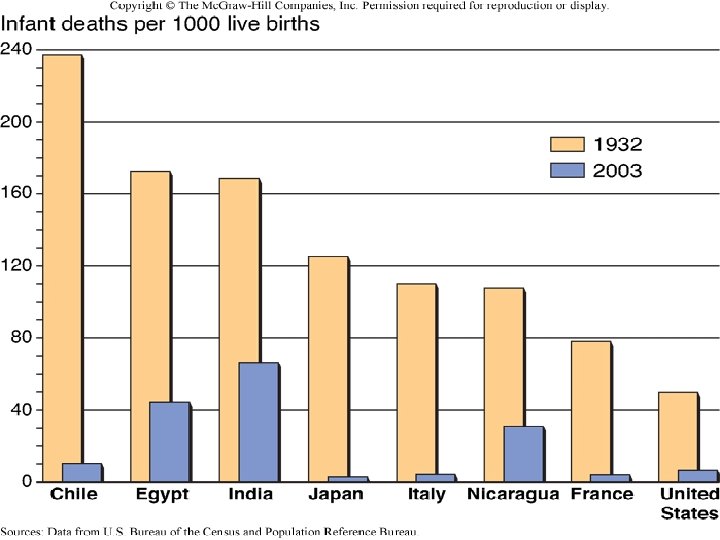
INFANT MORTALITY RATE • Deaths age one year or less per 1000 live births • This greatly reflects decline in general death rate numbers • Regional variations can occur within countries
ARTICLE READING & DISCUSSION Infant Mortality
PUT YOUR PYRAMID HW IN THE BASKET!
ARTICLE QUESTIONS 1. What is the OCED? 2. Why has the United States fallen behind other developed countries? 3. Does money/socioeconomic status affect infant mortality? How? 4. What effects over 20% of children born in the US? 5. Child mortality is between what two ages? 6. What are children 15 -18 more likely to die from in the US?
SIT IN YOUR NEW ASSIGNED SEAT!
RECAP FROM YESTERDAY 1. Why has the United States fallen behind other developed countries when it comes to infant mortality rates? 2. Does money/socioeconomic status affect infant mortality? How? 3. What effects over 20% of children born in the US? Get your notes out!
IS THE US THE SAFEST PLACE TO HAVE A BABY? • The US averages 6 deaths per 1, 000 babies • We are ranked 50 th in the world. Japan is #1 Why? • Causes for higher infant mortality rate • Industrialization of pregnancy & birth • High Poverty Rates • Unhealthy lifestyles • Health Care System • United States spends more money on helping already sick children instead of focusing on preventative care
LIFE EXPECTANCY RATE • Life expectancy = how long people live • 1 st - Monaco – 90 yrs • 2 nd - Japan – 85 yrs • 3 rd - Singapore- 85 years The United States is ranked 43 rd! On average, people only live to 80 in US • Raise you hand: Why do you think ours is lower?
MONACO • WHY ARE THEY LIVING SO LONG? • Read the two articles on Monaco and get ready for discussion
• Where is Monaco? What is the average life span? • What kind of lifestyle do people in Monaco live? • Give me a reason why people in Monaco live longer than Americans. • What country has a life expectancy of 50 years old? Why? • Pass your articles forward!
LOWEST LIFE EXPECTANCY • Currently, parts of Sub-Saharan Africa (south of the Sahara desert) • Chad – 50 yrs • Nigeria – 53 yrs • Uganda – 54 yrs • Disease • Political, religious, and ethnic unreast • Poor farming practices & infrastructure • Pollution
RATE OF NATURAL INCREASE • Subtract death rate from birth rate • Birth rate– death rate • rate gives demographers an idea of how a certain country's population is growing
POPULATION CONTROL • Pro-Natal Policies: Encourage child birth • May provide incentives for having more children • Japan has pro-natal policies! • Recently, their population has been declining due to changing cultural beliefs
POPULATION CONTROL • Anti-Natal Policies: Discourages child birth • The government may place restrictions on countries that have rapid population growth • China: • anti-natal during their “One Child Policy”
PUT YOUR NOTES AWAY! Stand up when you have put everything away!
ANALYSIS 1. In your opinion, do you believe the government has the right to limit the amount of children you have? Why or why not? 2. Were you surprised about other peoples choices today? Which questions? 3. Do you think the United States would ever do this to their citizens? Why or why not? • You should have 10 -12 sentences before you turn in your work! • When you finish, grab your Asia Map & Atlas work
STUDY FOR YOU SOUTH AMERICA QUIZ!
BELL RINGER • What country has the highest life expectancy? Why? • What country has the lowest life expectancy? Why?
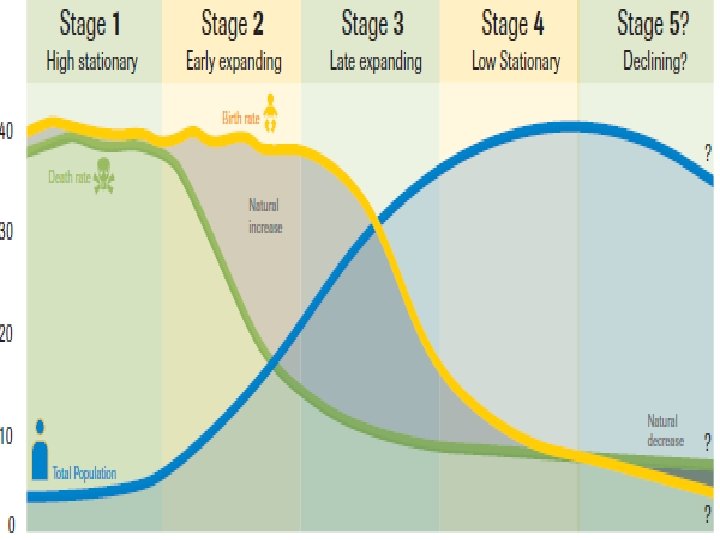
WHAT IS THE DEMOGRAPHIC TRANSITION MODEL? • Displays the evolution of human societies • transition from high birth & death rates to lower birth and death rates as a country develops
DEMOGRAPHIC TRANSITION MODEL • Displays the changing levels of fertility and mortality • Relationship between population growth & economic development • There are 5 STAGES!
STAGE 1 OF DTM 1. High birth rate/high death rate • ½ million years ago • Hunter/Gathering Societies • Women = 20 babies each • Half would die • No medicine so HIGH death rate
STAGE 2 OF DTM “INDUSTRIAL AGE” 2. Declining death rates, continuing high birth rates • Began 200 -300 years ago • Inventions (automobile, cotton gin) • Creation of medicine (death rates lower) • Example: Afghanistan! • Raise your hand: Why is Afghanistan in stage 2 right now?
STAGE 3 OF DTM • 3. Birth rates decline, death rates remain low • 100 years ago • Birth control = lower birth rates • LOWEST BIRTH RATE • When women are educated they have less children
STAGE 4 OF DTM POST INDUSTRIAL ERA 4. Very low birth rates & death rates • Population growth continues, but at a lower rate • Women are more active in the workplace • Attending college instead of staying home
POSSBLE STAGE 5 OF DTM • Declining populations • Rich industrialized nations • Heavy burden on small work force • Reverse population pyramids
POPULATION DENSITY VS POPULATION CONCENTRATION • Population density is the # of people in a certain area • Population concentration is how close people are to each other (Think about Orange Juice)
Which boxes have the most dots? (Population Density) In which box are the dots the closest? (Population Concentration)
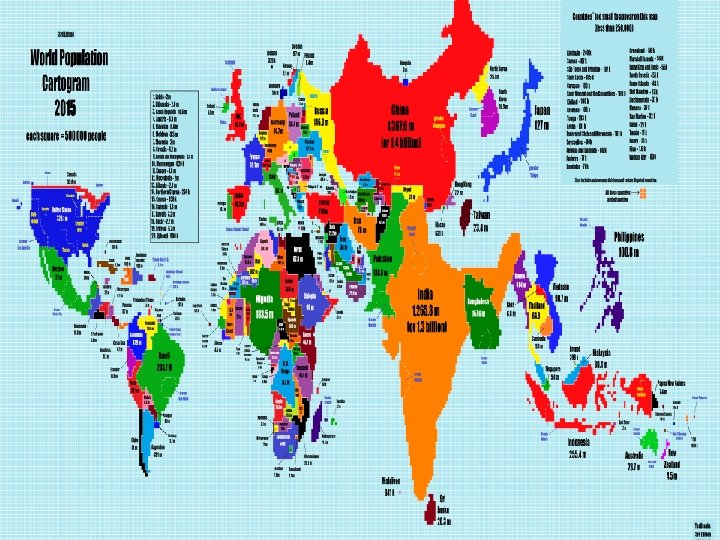
HOW DO WE DISPLAY POPULATION? • Cartogram: A map that shows distortions based on information or statistics
REVIEW DAY • TURN IN YOUR HW TO THE BASKET • Complete the following 1. Asia Atlas Work (Make sure your map is LABELED) 2. DTM/Population Practice 3. Study Guide • Staple all papers together – ALL should be used to study tonight!
STUDY FOR YOUR TEST!