
Unit 4 Managing 2 Accounting Monitoring the Business
Unit 4 – Managing 2 Accounting – Monitoring the Business
Objectives The following topics from Unit 4 of the syllabus are covered in this chapter �Why monitor the business? �Who is interested in the financial position of an enterprise? �How important is financial information to a business? �The final accounts �Ratio analysis �Accounting ratios
Monitoring a business How do we judge the success of a business? �Profit? �Sales? �Reputation? �Size of company? �Number of employees? �History? �Potential?
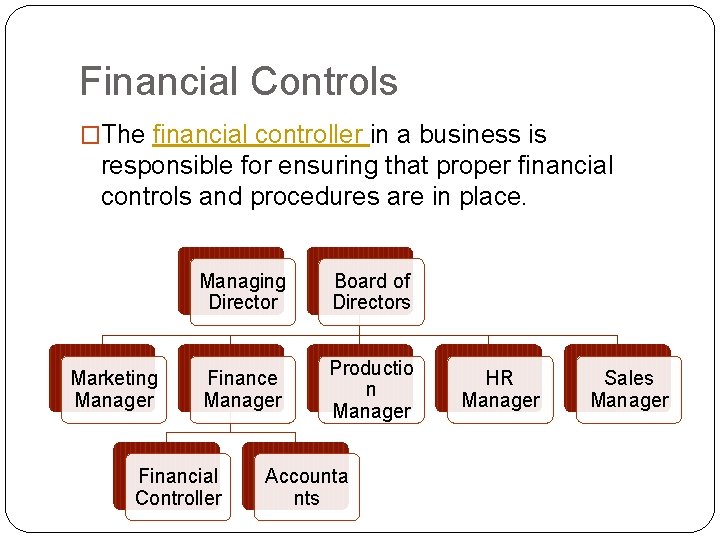
Financial Controls �The financial controller in a business is responsible for ensuring that proper financial controls and procedures are in place. Marketing Manager Managing Director Board of Directors Finance Manager Productio n Manager Financial Controller Accounta nts HR Manager Sales Manager
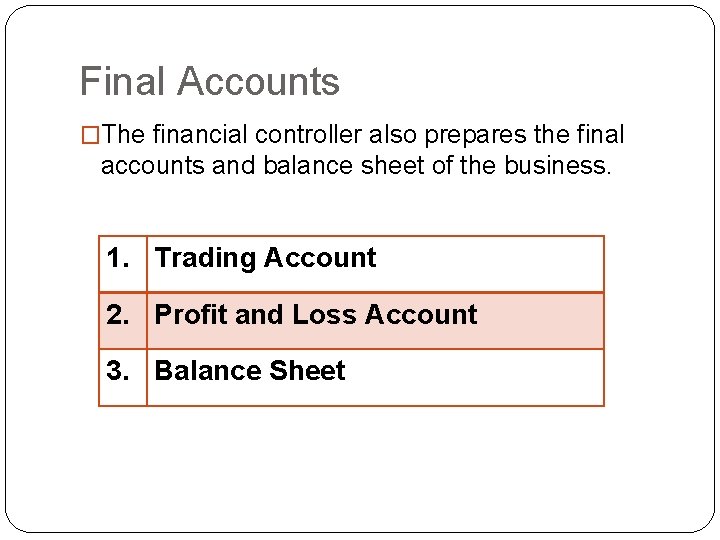
Final Accounts �The financial controller also prepares the final accounts and balance sheet of the business. 1. Trading Account 2. Profit and Loss Account 3. Balance Sheet
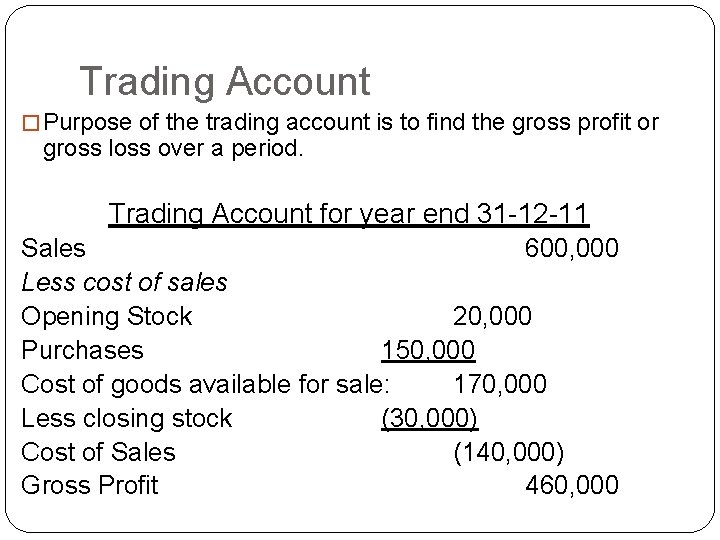
Trading Account � Purpose of the trading account is to find the gross profit or gross loss over a period. Trading Account for year end 31 -12 -11 Sales 600, 000 Less cost of sales Opening Stock 20, 000 Purchases 150, 000 Cost of goods available for sale: 170, 000 Less closing stock (30, 000) Cost of Sales (140, 000) Gross Profit 460, 000
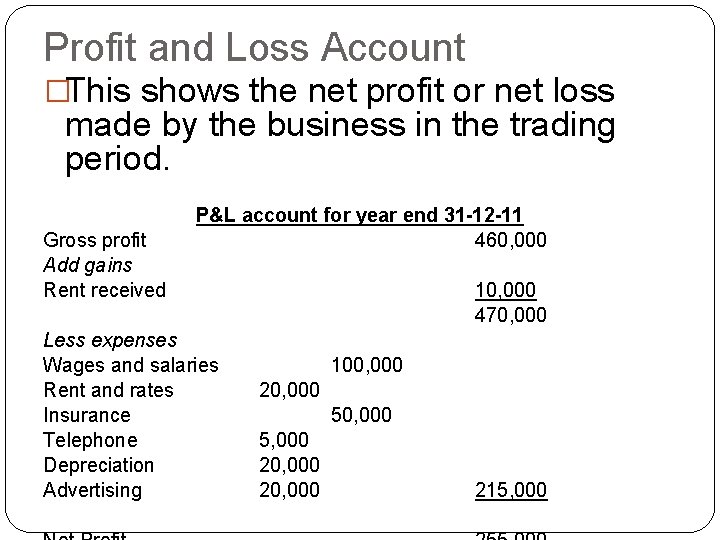
Profit and Loss Account �This shows the net profit or net loss made by the business in the trading period. Gross profit Add gains Rent received P&L account for year end 31 -12 -11 460, 000 Less expenses Wages and salaries Rent and rates Insurance Telephone Depreciation Advertising 10, 000 470, 000 100, 000 20, 000 5, 000 20, 000 215, 000
Advantages of Profit and Loss Account �It measures the success of the business compared to previous years. �It can help obtain loans of finance from banks. �It enables owners and managers to plan ahead. �It shows all the expenses and highlights where any increases have occurred.
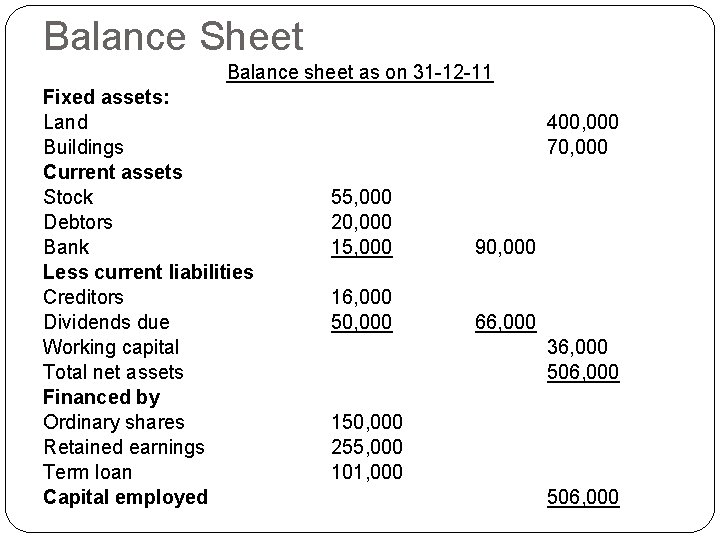
Balance Sheet Balance sheet as on 31 -12 -11 Fixed assets: Land Buildings Current assets Stock Debtors Bank Less current liabilities Creditors Dividends due Working capital Total net assets Financed by Ordinary shares Retained earnings Term loan Capital employed 400, 000 70, 000 55, 000 20, 000 15, 000 90, 000 16, 000 50, 000 66, 000 36, 000 506, 000 150, 000 255, 000 101, 000 506, 000
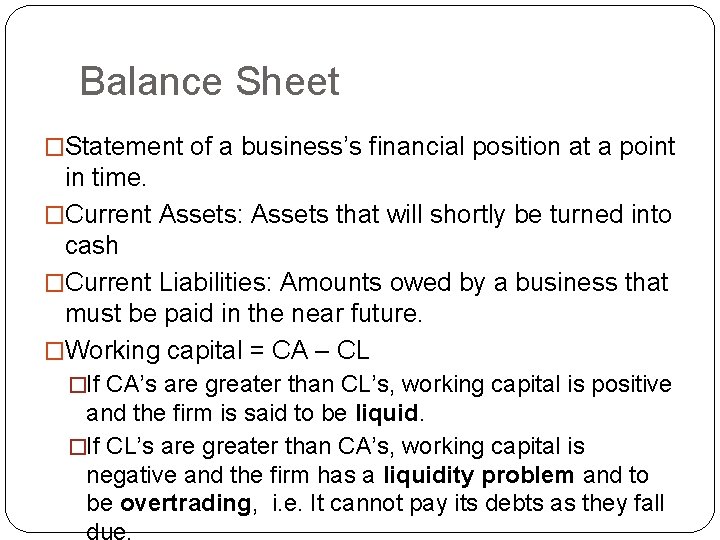
Balance Sheet �Statement of a business’s financial position at a point in time. �Current Assets: Assets that will shortly be turned into cash �Current Liabilities: Amounts owed by a business that must be paid in the near future. �Working capital = CA – CL �If CA’s are greater than CL’s, working capital is positive and the firm is said to be liquid. �If CL’s are greater than CA’s, working capital is negative and the firm has a liquidity problem and to be overtrading, i. e. It cannot pay its debts as they fall
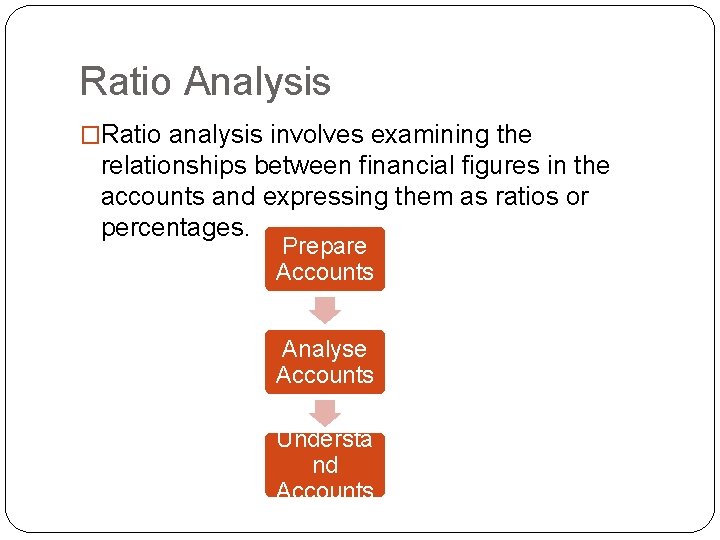
Ratio Analysis �Ratio analysis involves examining the relationships between financial figures in the accounts and expressing them as ratios or percentages. Prepare Accounts Analyse Accounts Understa nd Accounts
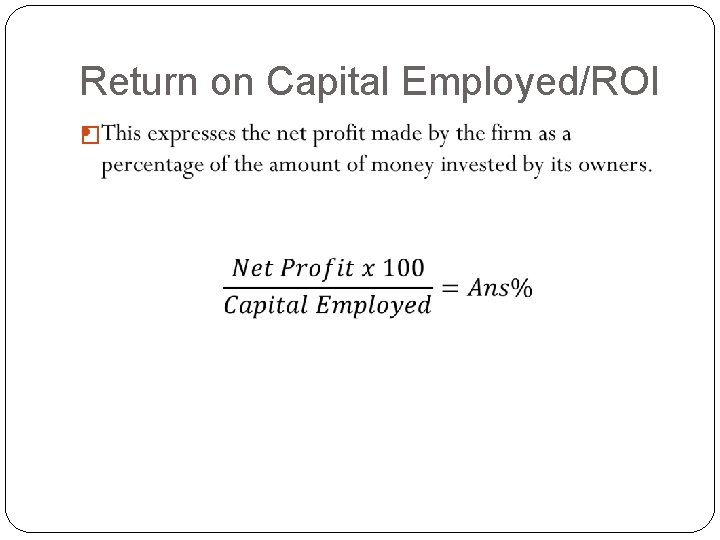
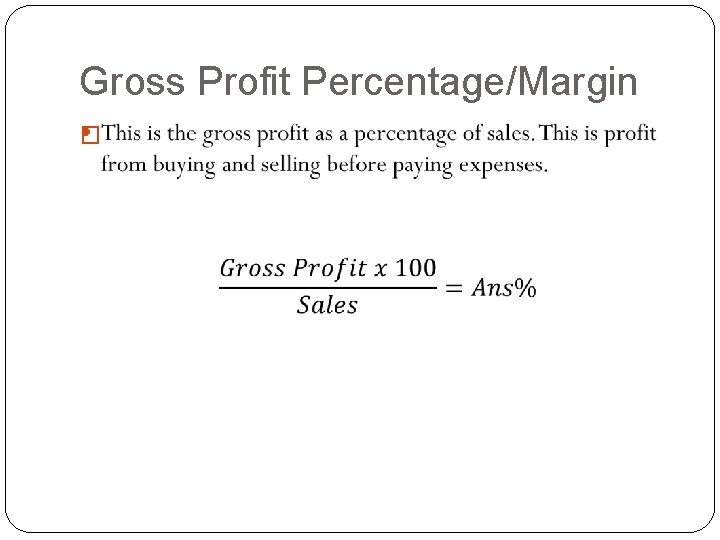
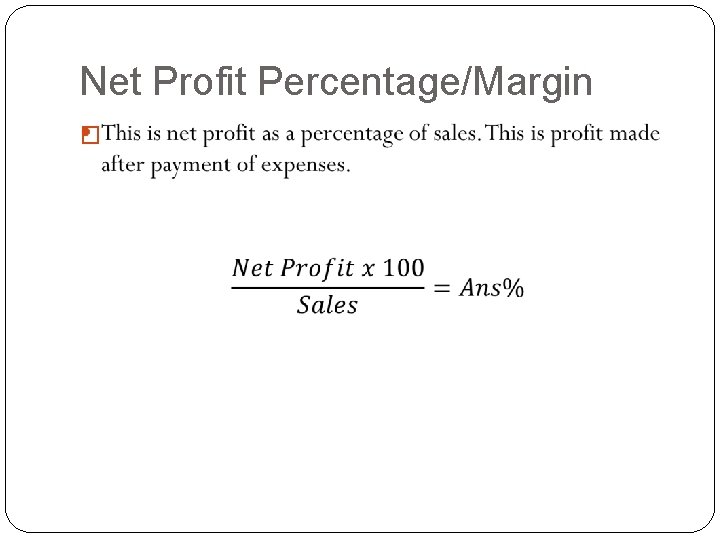
1. Profitability Ratios �These ratios show successful the management was in making profit in the business. �The profitability ratios are: �Return on Capital Employed/Return on Investment �Gross Profit Percentage/Margin �Net Profit Percentage/Margin
Return on Capital Employed/ROI �
Gross Profit Percentage/Margin �
Net Profit Percentage/Margin �
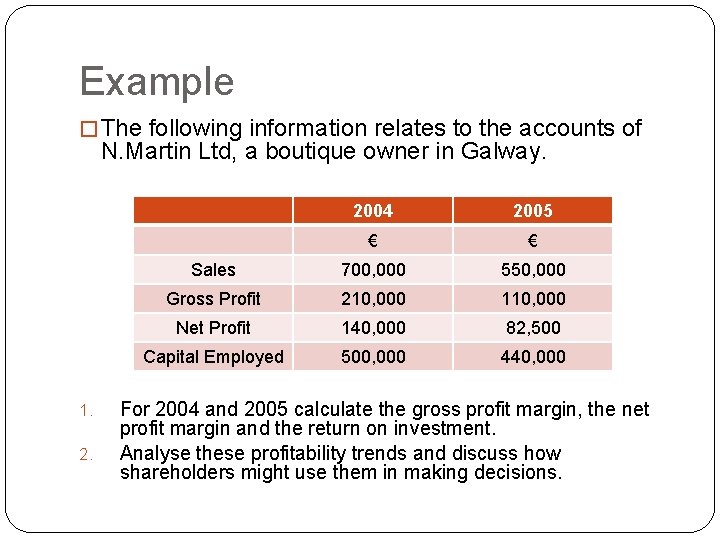
Example � The following information relates to the accounts of N. Martin Ltd, a boutique owner in Galway. 1. 2. 2004 2005 € € Sales 700, 000 550, 000 Gross Profit 210, 000 110, 000 Net Profit 140, 000 82, 500 Capital Employed 500, 000 440, 000 For 2004 and 2005 calculate the gross profit margin, the net profit margin and the return on investment. Analyse these profitability trends and discuss how shareholders might use them in making decisions.
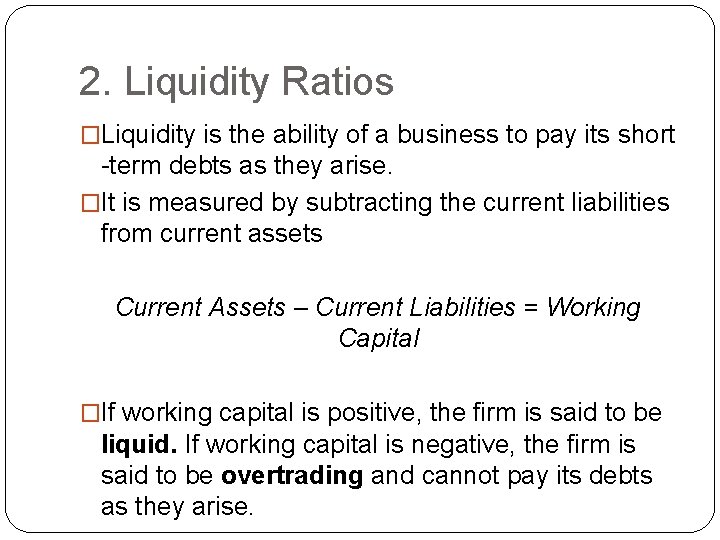
2. Liquidity Ratios �Liquidity is the ability of a business to pay its short -term debts as they arise. �It is measured by subtracting the current liabilities from current assets Current Assets – Current Liabilities = Working Capital �If working capital is positive, the firm is said to be liquid. If working capital is negative, the firm is said to be overtrading and cannot pay its debts as they arise.
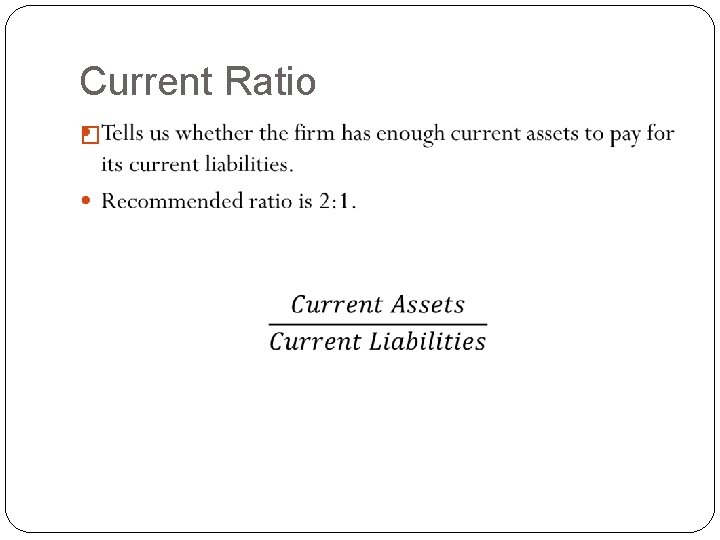
Current Ratio �
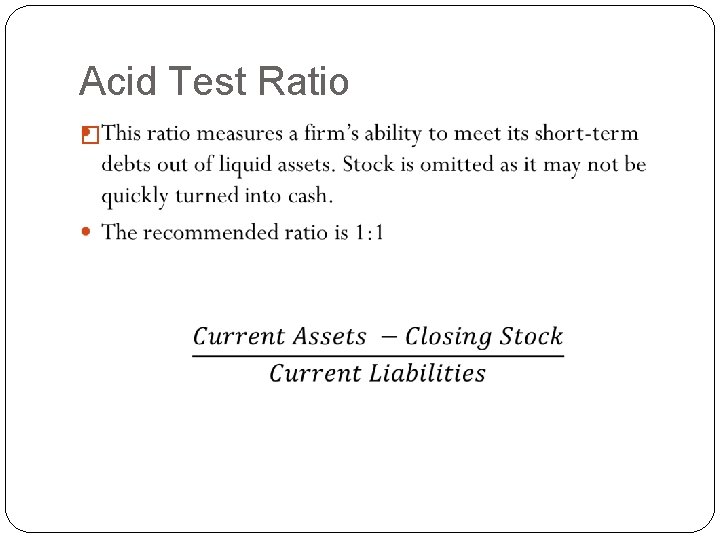
Acid Test Ratio �
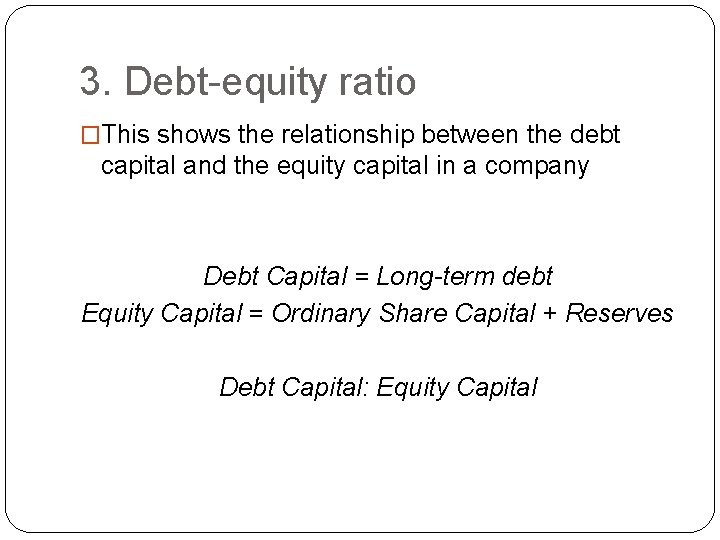
3. Debt-equity ratio �This shows the relationship between the debt capital and the equity capital in a company Debt Capital = Long-term debt Equity Capital = Ordinary Share Capital + Reserves Debt Capital: Equity Capital
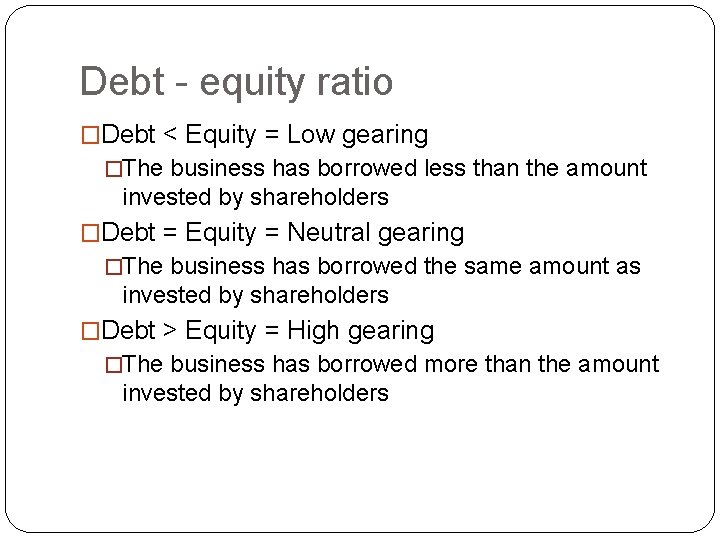
Debt - equity ratio �Debt < Equity = Low gearing �The business has borrowed less than the amount invested by shareholders �Debt = Equity = Neutral gearing �The business has borrowed the same amount as invested by shareholders �Debt > Equity = High gearing �The business has borrowed more than the amount invested by shareholders
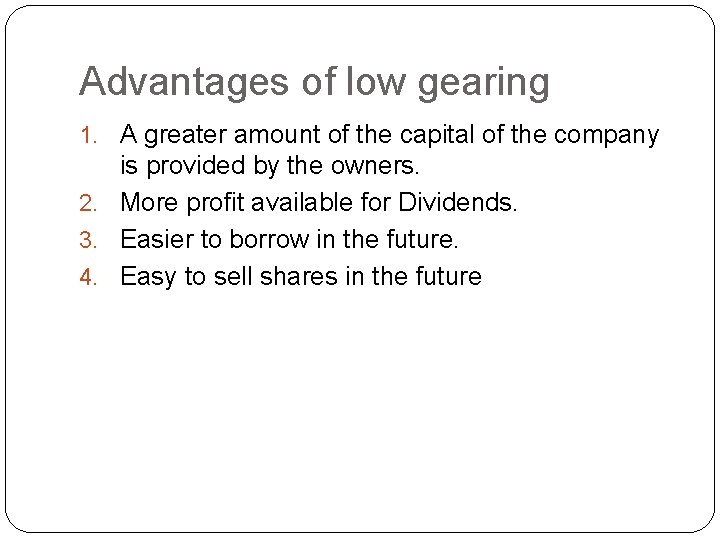
Advantages of low gearing 1. A greater amount of the capital of the company is provided by the owners. 2. More profit available for Dividends. 3. Easier to borrow in the future. 4. Easy to sell shares in the future
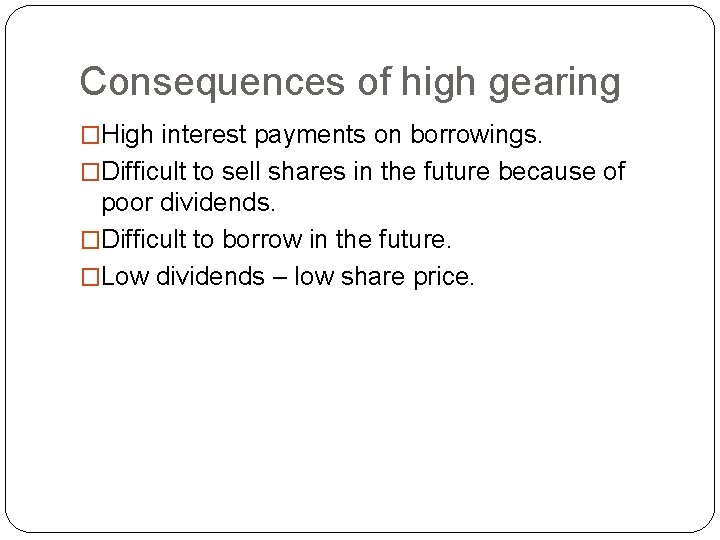
Consequences of high gearing �High interest payments on borrowings. �Difficult to sell shares in the future because of poor dividends. �Difficult to borrow in the future. �Low dividends – low share price.
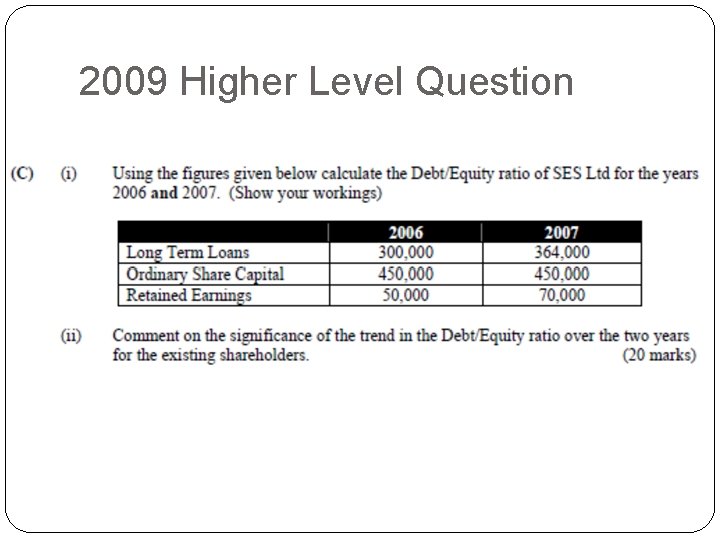
2009 Higher Level Question
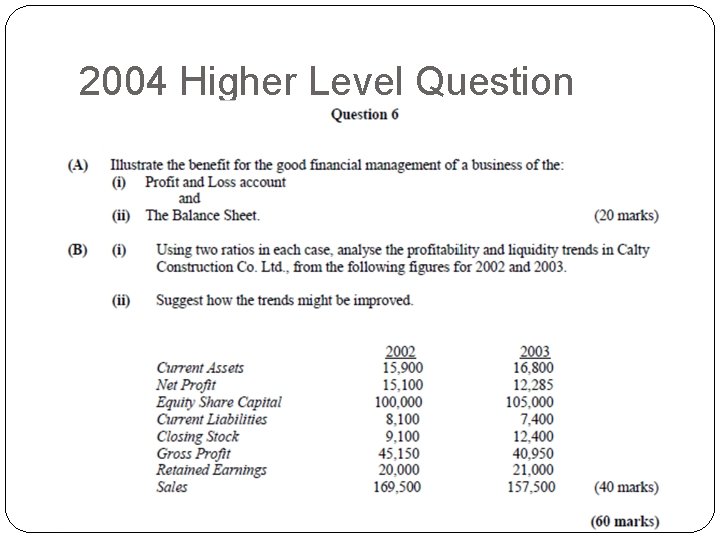
2004 Higher Level Question
- Slides: 25