UNIT 3 STATISTICAL DATA ANALYSIS FORMULATION AND TESTING

- Slides: 11
UNIT 3 STATISTICAL DATA ANALYSIS
FORMULATION AND TESTING OF HYPOTHESES Hypotheses are considered as the principal instrument in research. Its main function is to suggest new experiments, observations or surveys. In the case of experimental research testing of hypotheses is the major objective.
What is hypothesis? � Hypothesis could be a statement to be verified by survey, observation or experiment � It could be a tentative solution to a problem of the researcher or a tentative answer to the researcher’s question to be verified by appropriate means � It could be a tentative generalization, an assumption or a shrewd guess to be proved � It could be a contextual statement of relation between two or more variables. � It could be a proposition. Proposition is a statement about observable phenomena (concepts) that may be tested as true or false. When a proposition is formulated for empirical testing, it is called hypothesis. It’s a declarative statement, a hypothesis is of a tentative nature.
Sources of hypotheses As in the case of defining problem there a few sources which help researchers formulating hypotheses. � Theory: One can derive hypotheses from management theories. Take for example Abraham Maslow’s theory of hierarchy of need in motivation. Maslow suggested that the higher need comes to play when the lower need is satisfied. A hypothesis can be formulated relative to this theory as ‘In spirituality oriented people Maslow’s hierarchy of needs is not true’. � Observations: Routine observations of price movement in the market place, employees’ behaviour on the job / off the job, the movement of sensex points and etc. may lead to new hypotheses Example: The higher rate for organic produce is not related to lower production � Intuition and personal experience: In certain cases intuition or gut feelings help formulate hypotheses. But in many cases experience of the researcher in a particular filed over years guides to appropriate and meaningful hypotheses. � Analogies (Comparison): Hypotheses can be formed based on the examples in other areas/disciplines. � Review of literature: The habit of going through periodicals, abstracts, reviews etc will help locating hypotheses. As in the case of defining problem, the role played by review of literature in forming hypotheses is significant. � General culture: The kaleidoscopic cultures seen in different strata of the society and the well-ingrained organizational cultures in various corporates throw light in locating hypotheses.
FORMULATION NULL HYPOTHESIS(HO) AND ALTERNATIVE HYPOTHESIS (HA). �Based on the problem identified, null hypothesis and appropriate alternative hypothesis (nondirectional or directional) are formulated. �The N. H. and A. H. are formed before the sample is drawn. Null hypothesis is the one the researcher wishes to disprove and the A. H. is usually the one which the researcher wishes to prove.
Steps in hypothesis-testing (6 steps) �Step 1: State the null as well as the alternative hypotheses. Though the researcher is usually interested in testing hypotheses of change or difference, the N. H. is always used for statistical purpose. �Step 2: Choose the statistical test: An appropriate statistical test [ Z, t, F, Chi-square, ANOVA or any nonparametric test] is selected depending the problem. �Step 3: Select the desired level of significance: The exact level to choose is largely determined by how much risk one is prepared to take 0. 10 [10%], 0. 05 [5%], 0. 025 [2. 5%] or 0. 01[1%]. The most common level is 0. 05[5%]
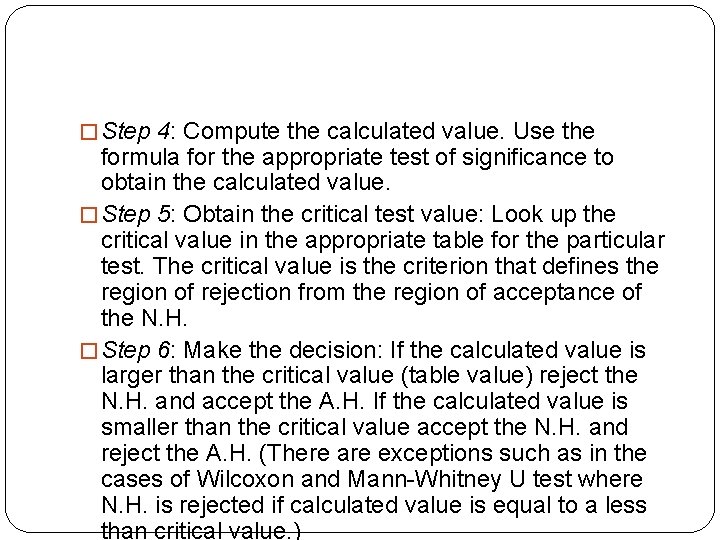
� Step 4: Compute the calculated value. Use the formula for the appropriate test of significance to obtain the calculated value. � Step 5: Obtain the critical test value: Look up the critical value in the appropriate table for the particular test. The critical value is the criterion that defines the region of rejection from the region of acceptance of the N. H. � Step 6: Make the decision: If the calculated value is larger than the critical value (table value) reject the N. H. and accept the A. H. If the calculated value is smaller than the critical value accept the N. H. and reject the A. H. (There are exceptions such as in the cases of Wilcoxon and Mann-Whitney U test where N. H. is rejected if calculated value is equal to a less than critical value. )
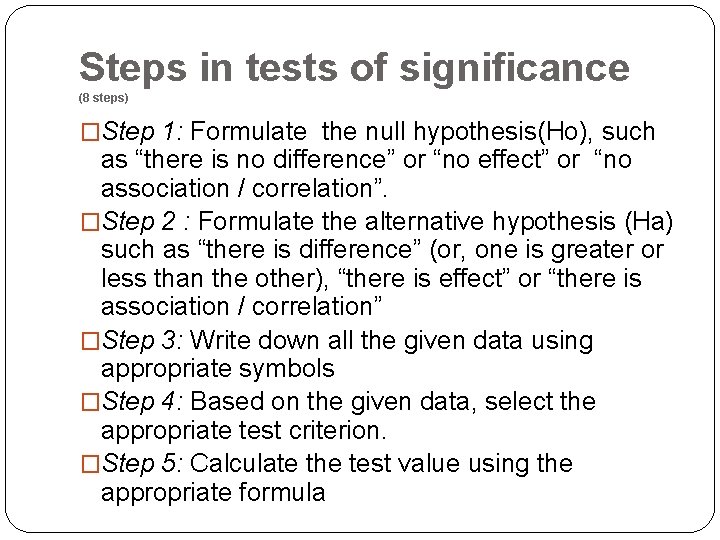
Steps in tests of significance (8 steps) �Step 1: Formulate the null hypothesis(Ho), such as “there is no difference” or “no effect” or “no association / correlation”. �Step 2 : Formulate the alternative hypothesis (Ha) such as “there is difference” (or, one is greater or less than the other), “there is effect” or “there is association / correlation” �Step 3: Write down all the given data using appropriate symbols �Step 4: Based on the given data, select the appropriate test criterion. �Step 5: Calculate the test value using the appropriate formula
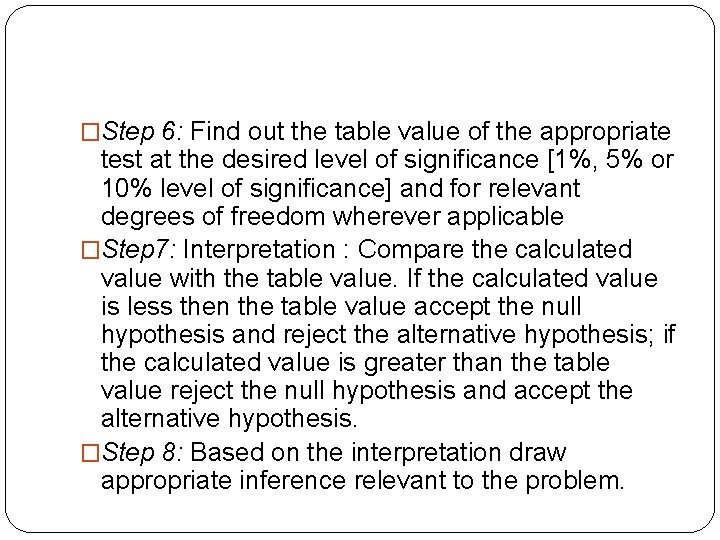
�Step 6: Find out the table value of the appropriate test at the desired level of significance [1%, 5% or 10% level of significance] and for relevant degrees of freedom wherever applicable �Step 7: Interpretation : Compare the calculated value with the table value. If the calculated value is less then the table value accept the null hypothesis and reject the alternative hypothesis; if the calculated value is greater than the table value reject the null hypothesis and accept the alternative hypothesis. �Step 8: Based on the interpretation draw appropriate inference relevant to the problem.
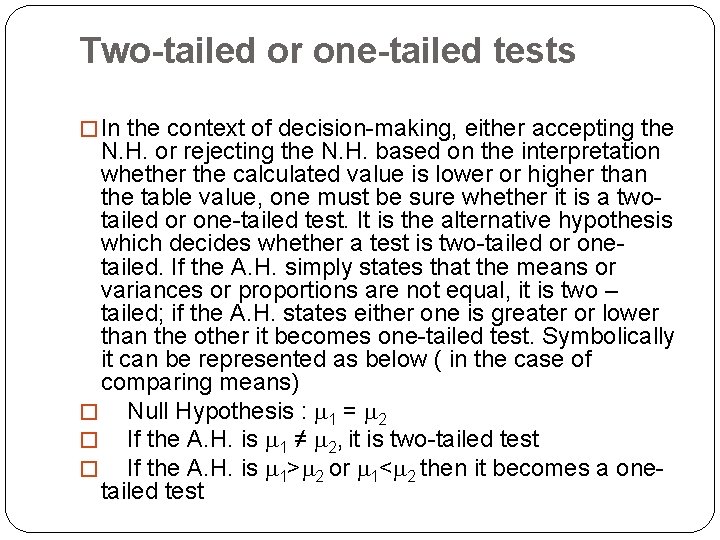
Two-tailed or one-tailed tests � In the context of decision-making, either accepting the N. H. or rejecting the N. H. based on the interpretation whether the calculated value is lower or higher than the table value, one must be sure whether it is a twotailed or one-tailed test. It is the alternative hypothesis which decides whether a test is two-tailed or onetailed. If the A. H. simply states that the means or variances or proportions are not equal, it is two – tailed; if the A. H. states either one is greater or lower than the other it becomes one-tailed test. Symbolically it can be represented as below ( in the case of comparing means) � Null Hypothesis : 1 = 2 � If the A. H. is 1 ≠ 2, it is two-tailed test � If the A. H. is 1> 2 or 1< 2 then it becomes a onetailed test
Parametric vs Non- parametric tests The tests of significance, in general, are grouped as parametric and non – parametric (distribution free) tests. As the terms indicate, in parametric tests such as Z-test, t-test, Ftest, ANOVA etc, relevant parameters of the population such as total no. of units or size of the population(N), mean of the population (µ) and variance (σ2) or standard deviation (σ) are known. In the case of non-parametric tests the population parameters are inadequate.