Unit 3 b Imperfect Competition Monopolies Monopolistic Competition

Unit 3 b- Imperfect Competition • Monopolies • Monopolistic Competition • Oligopolies

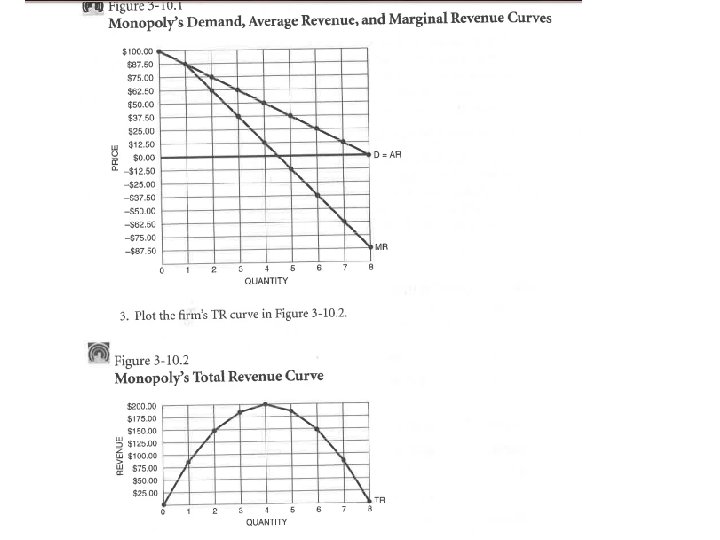
Monopoly • MR twice slope of D • D=AR • MR = 0 @ TR maximizing Q

Using MR to determine the price elasticity of demand

Answer Key

Answer Key

Important! • Average x Q = Total & Total /Q = Average • Total = Marginal • Variable Cost + Fixed Cost = Total Cost • Revenue – Cost = Profit

Answer Key

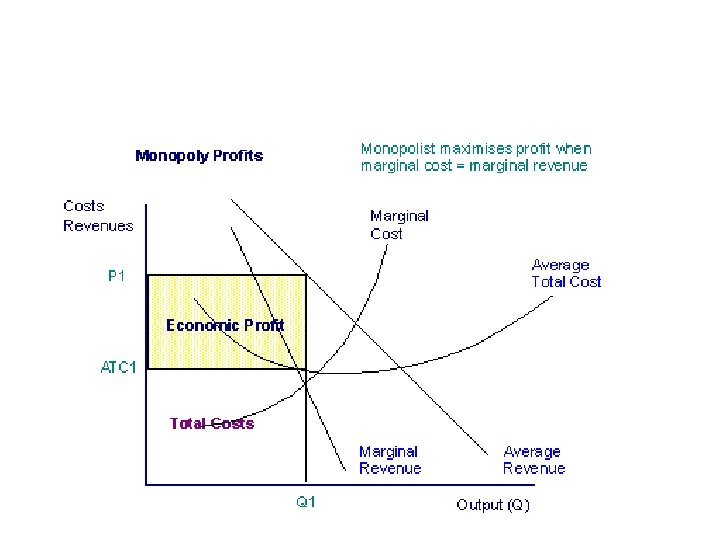
• Max. Profit @ Q where MR = MC
 – Public Utilities – Cable")
Monopolies • Pure Monopolies (rare and likely not “pure”) – Public Utilities – Cable TV (in some locations) – Sports Teams? • Near Monopolies – Intel (81%) – Wham-O (90%) – De Beers (55%)

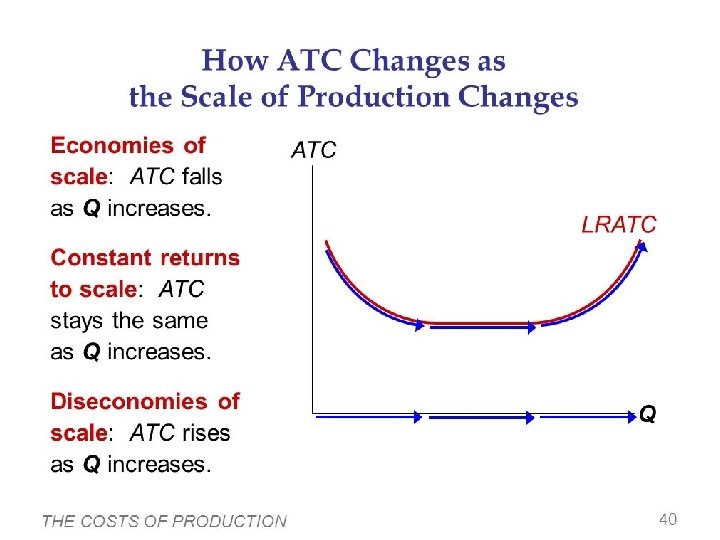
Barriers To Entry • Economies of Scale – “Natural Monopoly” • Demand intersects LRATC where LRATC is still declining • LRATC continues to decrease at high levels of output

Constructing the LRATC

LONG RUN ONLY! The terms Economies/Diseconomies of Scale do NOT apply to the short run ATC
")
Minimum Efficient Scale (MES)
 • Minimum output at which lowest LRATC is achieved")
Minimum Efficient Scale (MES) • Minimum output at which lowest LRATC is achieved
 • If there is a natural monopoly, one firm can")
Minimum Efficient Scale (MES) • If there is a natural monopoly, one firm can produce enough to satisfy market demand before achieving MES
 • In perfect competition, is MES at a low Q?")
Minimum Efficient Scale (MES) • In perfect competition, is MES at a low Q? • This allows MANY small firms to produce at competitive output levels
 • In a natural monopoly, is MES at a very")
Minimum Efficient Scale (MES) • In a natural monopoly, is MES at a very high Q? • One firm achieves a lower cost of production than multiple firms would and MES is not reached.

Natural Monopoly- LRATC is downward sloping at intersection with D

Barriers To Entry • Legal – Patents/Copyrights – Licenses • • FCC Taxis Liquor Licenses Marijuana Dispensary

Barriers To Entry • Ownership/Control of Resources – Natural Resources • Inco (90% of known nickel) • Geographic – Diner in a small desert town • Consumer Loyalty • Capital Costs

Barriers to Entry • Pricing – Predatory – Economies of Scale • Advertising and Other Practices – Influence consumer tastes – Creates perception of quality


Competitive v. Monopolist Price and Output

Competitive Consumer/Producer Surplus

Monopolist Consumer/Producer Surplus/DWL

Is a Monopoly Productively Efficient?

Is a Monopoly Allocatively Efficient?

Conclusions About Monopolist’s P and Q

Welcome to Market Failure

Natural Monopoly Regulatory Options What happens if the monopoly is broken?

Natural Monopoly- LRATC is downward sloping at intersection with D

Natural Monopoly Regulatory Options

Natural Monopoly Regulatory Options

Natural Monopoly Regulatory Options 1. Unregulated: Price on D above MR = MC 2. Fair Return: P = ATC 3. Social Optimal (Allocatively Efficient) P = MC

Monopoly • Monopolists do not face a supply curve • It is the Price Maker
 • In a natural monopoly, is MES at a low")
Minimum Efficient Scale (MES) • In a natural monopoly, is MES at a low or high Q?

Natural Monopoly- LRATC is downward sloping at intersection with D

Welcome to Market Failure

Natural Monopoly Regulatory Options

Natural Monopoly Regulatory Options What happens if the monopoly is broken?

Natural Monopoly Regulatory Options

Natural Monopoly Regulatory Options 1. Unregulated: Price on D above MR = MC 2. Fair Return: P = ATC 3. Social Optimal (Allocatively Efficient) P = MC

PER UNIT V. LUMP SUM *Applies to Tax or Subsidy • PER UNIT – SHIFTS MC – Changes profit-max. Q and P – Variable cost • LUMP SUM – SHIFTS only FC/ATC, THEREFORE, NOT Q – Fixed cost – P and Q same; Profit/Loss Changes

Natural Monopoly Regulatory Options

Price Discrimination Conditions 1. Market Power 2. Market Segregation 3. No Resale
 -Each consumer charged maximum willing price")
Price Discrimination Types 1. 1 st Degree (Perfect) -Each consumer charged maximum willing price -Consumer surplus = 0 2. 2 nd Degree -Different Quantities, Different Prices -Reduces, but doesn’t eliminate consumer surplus 3. 3 rd Degree - Different groups/times

Deadweight Loss • Under allocation – Output less than socially optimal – Area of underproduction where MB > MC – Unregulated monopoly

Deadweight Loss • Over allocation – Output greater than socially optimal – Area of overproduction where MC > MB

Monopolistic Competition

Which go together? • • • Allocatively Efficient Productively Efficient Profit-Max. Fair Return Socially Optimal Min. ATC MR = MC P = ATC P = MC

Product Differentiation • Physical Differences • Perceived Differences • Support Services

Monopoly v. Monopolistic Competition • Why is it called monopolistic competition? • How will the demand curve differ? • Long Run? (remember- no barriers)

Excess Capacity • Q Gap between profit max. and min. ATC

Distinguishing Between Monopolistic Competition and Oligopolistic Structures • 4 Firm Concentration • HHI • The Real Test

4 Firm Concentration Ratio • Sum of 4 largest firms’ market share • > 40% = Oligopoly • < 40% = Monopolistic Competition

Herfindahl-Hirschman Index • Sum of squared market shares of all firms • s 12 + s 22 + … • Range of 0 - 10, 000

Herfindahl-Hirschman Index • Sum of squared market shares of all firms • (% Share of Firm 1)2 + (% Share of Firm 2)2 … • Range of 0 - 10, 000

Natural Oligopoly Dollars LRATCTypical Firm H $200 F E 80 DMarket 0 25, 000 100, 000 Units per Month 61

Oligopoly- Kinked Demand

Horizontal Merger • Two companies in same industry – Red Flag: HHI increase of 100 or more

Vertical Merger • Two companies in complimentary industries

Potential Competition Merger

FTC

Denied
 – Banned predatory and unfair business practices")
Antitrust Laws • Sherman Antitrust Act (1890) – Banned predatory and unfair business practices • Clayton Antitrust Act (1914) – Specified unfair practices • • Interlocking Directories Price Discrimination Exclusive Dealings and Tying Horizontal Mergers that Destroy Competition • Federal Trade Commission (FTC) – Approves mergers and enforces trade regulations

• • Homework List Legibly Applied to Our Simulation Players, Strategies, Payoffs Dominate Strategy Nash Equilibrium Explicit Collusion Tacit Collusion Tit for Tat Cheating Cartel

Game Theory • Players, Strategies, and Payoffs • Dominate Strategy – A player has a single best strategy regardless of opponent’s strategy decision • Nash Equilibrium – No player can benefit from a unilateral move • Dominate Strategy Equilibrium – Nash Equilibrium AND both players are playing a dominate strategy

Circle Method • Dominate Strategy – Player on Left • Two circles in same row – Player on Top • Two circles in same column • Nash Equilibrium – Two circles in same box • Dominate Strategy Equilibrium – Two Circles in same box and both players have dominate strategy

FRQs • #1 - Monopoly Graph • #2 - Payoff Matrix
- Slides: 73