Unit 2 Research Methods Module 4 The Need


 • Median (middle score)")


- Slides: 31
Unit 2: Research Methods Module 4: The Need for Psychological Science Module 5: The Scientific Method and Description Module 6: Correlation and Experimentation Module 7: Statistical Reasoning in Everyday Life Module 8: FAQ’s about Psychology
Did We Know It All Along? Hindsight Bias: • the tendency to believe, after learning an outcome, that one would have foreseen it. • Also known as the “I knew it all along” phenomenon.
Overconfidence • We tend to think we know more than we do – Richard Goranson Study (1978) • • WREAT ----- WATER ETRYN------ ENTRY GRABE------ BARGE OCHSA
Perceiving Order in Random Events • Comes from our need to make sense out of the world – Coin flip – Poker hand – Your test/quiz answers “An event that happens to but 1 in 1 billion people everyday occurs 7 times a day, 2, 500 times a year”
The Scientific Attitude: Curious, Skeptical and Humble • Three main components – Curious eagerness – Skeptical but not cynical, open but not gullible – Open-minded humility before nature • Key Point: Hindsight bias, overconfidence and our tendency to perceive patters in random events often lead us to overestimate our intuition.
The Scientific Method • Theory • an explanation using an integrated set of principles that organizes observations and predicts behaviors or events. • Hypothesis • • a testable prediction, often implied by a theory. Can be confirmed or refuted
The Scientific Method • Operational Definitions: • In order to do research on subjective concepts (i. e. , love, fear, anxiety) researchers must make these subjective concepts objective. • They must be observable and measurable. • Operational definition of Anger for a road rage study: – Anger will be defined as presence of 3 of the following: Ø Increase in heart rate Ø Emotional Outbursts Ø Flushing of the face Ø Self report of anger (likert scale) Ø Physical Confrontation
The Scientific Method • Replication – repeating the essence of a research study, usually with different participants in different situations, to see whether the basic finding extends to other participants and circumstances – Must have clear operational definition to replicate a study
The Scientific Method
Description • Case Study • an descriptive technique in which one individual or group is studied in depth in the hope of revealing universal principles • Pros? • Cons?
Description • Naturalistic Observation – Describes behavior – Does not explain behavior – Pros? Cons?
Description • Survey – Looks at many cases at once – Anonymous • What percent of people pee in the shower? • Word effects • Random sampling – Representative sample – Sampling bias Just for fun…
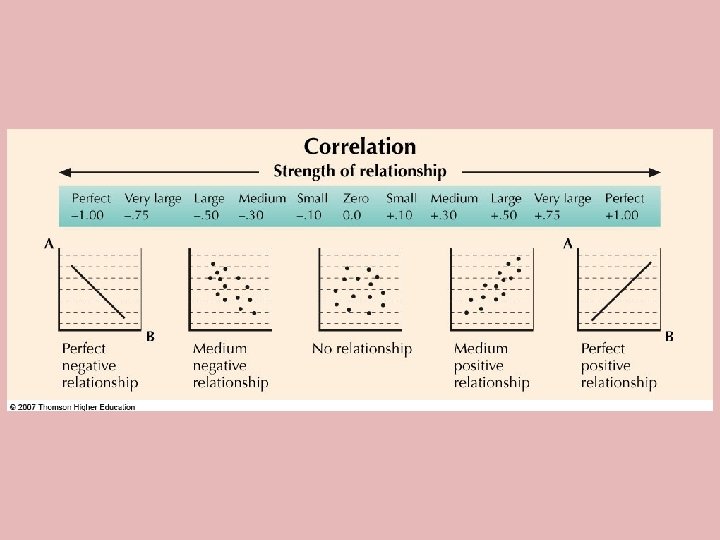
Correlation • When two variables are related to each other, they are correlated. • Correlation = numerical index of degree of relationship – Correlation expressed as a number between 0 and 1 – Can be positive or negative – Numbers closer to 1 (+ or -) indicate stronger relationship
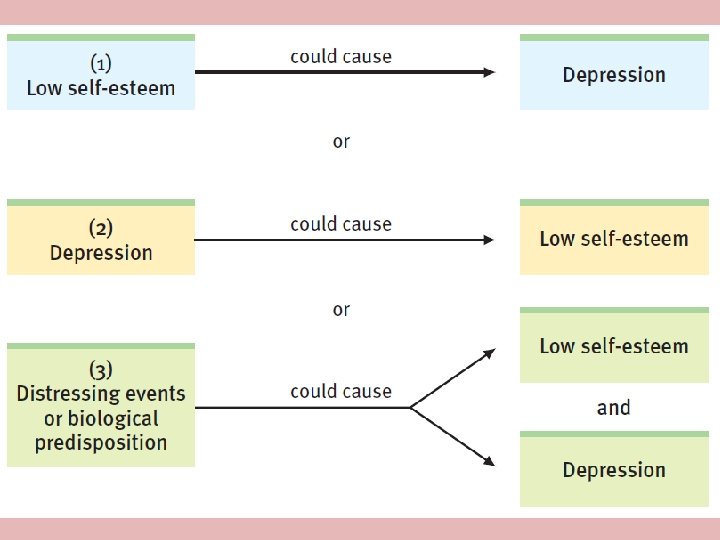
Correlation • Higher correlation coefficients = increased ability to predict one variable based on the other – SAT/ACT scores moderately correlated with first year college GPA • 2 variables may be highly correlated, but not causally related – Foot size and vocabulary positively correlated – Do larger feet cause larger vocabularies? – The third variable problem
Correlation • Illusory Correlation – Perceived but non-existent correlation – A random coincidence
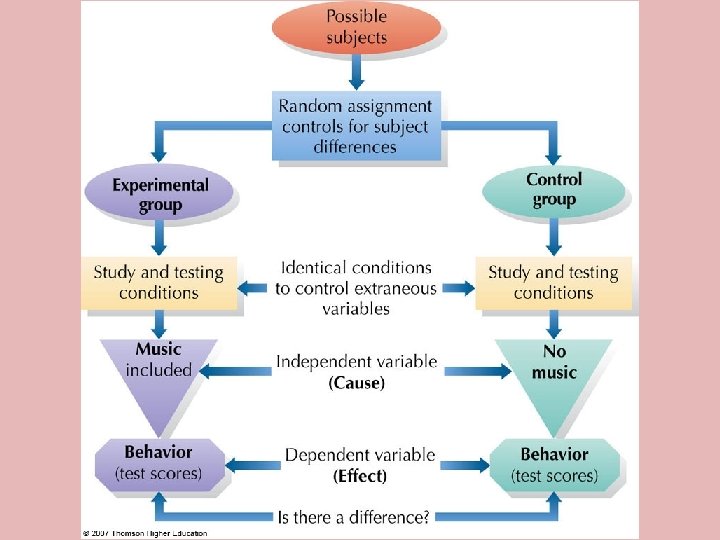
Experimental Design • Experiment = manipulation of one variable under controlled conditions so that resulting changes in another variable can be observed – Detection of cause-and-effect relationships • Independent variable (IV) = variable manipulated • The Cause • Dependent variable (DV) = variable affected by manipulation • The Effect
Experimental Design • Experimental group – Gets the IV • Control group – Does not get the IV • Random assignment – Necessary to minimize extraneous variables • Extraneous and confounding variables – Might alter the accuracy of results • Participants are sleepy, in a bad mood, sick, etc. Resulting differences in the two groups must be due to the independent variable
Methodological Pitfalls • Sampling bias – Not using a diverse group of your population • Placebo effects • Distortions in self-report data: – Social desirability bias • Saying whatever you think the researcher wants you to say – Response set • Tendency to always mark the same answer • Experimenter bias – the double-blind solution
Descriptive Stats: Histogram
Descriptive Stats: Measures of Central Tendency • Mean (arithmetic average) • Median (middle score) • Mode (occurs the most)
Normal Bell Curve
Inferential Statistics: Statistical Significance • Statistical significance = when the probability that the observed findings are due to chance is very low – Very low = less than 5 chances in 100/. 05 level – Represented by a “p” – Ex: p=. 02 would mean that there was a 2 in 100 chance that the results were due to chance.
Ethics in Research • The question of deception • The question of animal research – Controversy among psychologists and the public • Ethical standards for research: the American Psychological Association – Ensures both human and animal subjects are treated with dignity