Unit 2 Research Methods Module 04 The Need


 – How well does A predict B – Positive")


 – Control")

 – Single-Blind Procedure – Double-Blind Procedure • Placebo Effect")


 – Scale labels")
 Median (middle score)")


")


- Slides: 46
Unit 2: Research Methods
Module 04: The Need for Psychological Science
Errors of Common Sense Try this ! Fold a piece of paper (0. 1 mm thick) 100 times. How thick will it be? 800, 000, 000 times the distance between the sun and the earth. 4
The Scientific Attitude: Curious, Skeptical and Humble • Three main components – Curious eagerness – Skeptically scrutinize competing ideas – Open-minded humility before nature • Hindsight bias, overconfidence and our tendency to perceive patters in random events often lead us to overestimate our intuition.
Critical Thinking • Critical Thinking – “Smart thinking” – Elements • Examines assumptions • Assesses the source • Discerns hidden values • Confirms evidence • Assesses conclusions
The Scientific Method • Theory – “mere hunch” • Hypothesis – Can be confirmed or refuted • Operational Definition • Replication (repeat)
The Scientific Method • A good theory is useful if it: – Effectively organizes a range of self-reports and observations – Leads to clear hypotheses (predictions) that anyone can use to check theory – Often stimulates research that leads to a revised theory which better predicts what we know
Description
Description The Case Study • Case Study – Hope to reveal universal truths – Problems with atypical individuals – Cannot discern general truths
Description Naturalistic Observation • Naturalistic Observation – Describes behavior – Does not explain behavior
Description The Survey • Survey – Looks at many cases at once • Word effects • Random sampling – Representative sample – Sampling bias
Survey 14 Random Sampling If each member of a population has an equal chance of inclusion into a sample, it is called a random sample (unbiased). If the survey sample is biased, its results are not valid. The fastest way to know about the marble color ratio is to blindly transfer a few into a smaller jar and count them.
Description The Survey • Sampling – Population – Random Sample
Correlation • Correlation (correlation coefficient) – How well does A predict B – Positive versus negative correlation – Strength of the correlation • -1. 0 to +1. 0 – Scatterplot
Correlation
Correlation
Correlation
Correlation
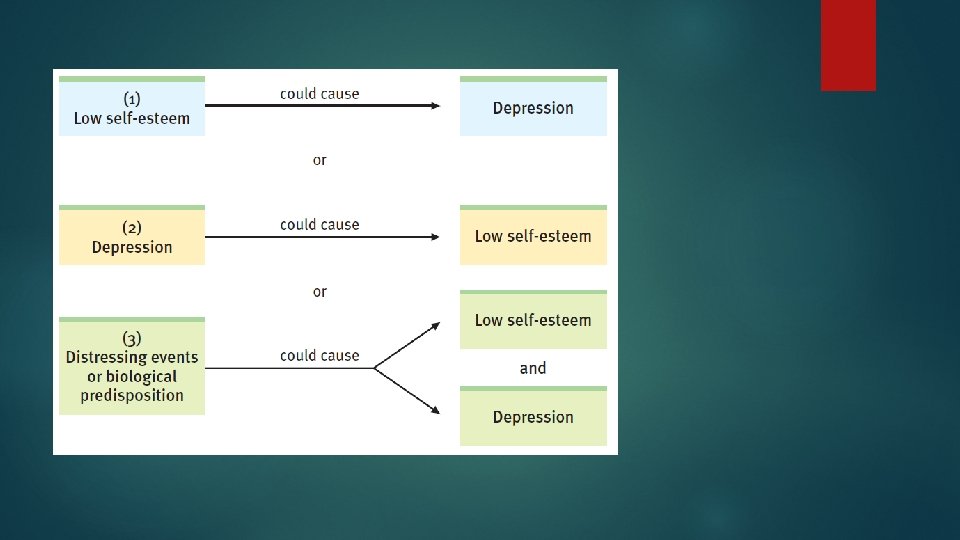
Correlation and Causation • Correlation helps predict – Does not imply cause and effect
Correlation Illusory Correlations • Illusory Correlation – Perceived non-existent correlation – A random coincidence
Experimentation • Experiment – Can isolate cause and effect – Control of factors • Manipulation the factor (s) of interest • Hold constant (“controlling”) factors
Experimentation • Groups – Experimental Group • Receives the treatment (independent variable) – Control Group • Does not receive the treatment
Experimentation • Randomly assigned – Eliminates alternative explanations – Equalizes the two groups – Reduces the influence of other (confounding variables) – Different from random sample
Experimentation • Blind (uninformed) – Single-Blind Procedure – Double-Blind Procedure • Placebo Effect
Experimentation Independent and Dependent Variables • Independent Variable – Confounding variable • Effect of random assignment on confounding variables • Dependent Variable – What is being measured • Validity
Comparing Research Methods
Next Zoom Meeting Thursday April 16 12: 30 Have completed Assigned reading – On class website - kssmcconnell. weebly. com Assigned Unit 1 Free Response Question – on My. AP Site Research Methods review video from the College. Board https: //www. youtube. com/watch? v=k. QUT 9 Og. F 1 Xo&list=PLo. Ggviqq 4844 U 91 iot. DP 7 n 7 br. R_ovo. SFB&index=6 Recommend watching at faster speed, slow down, take notes, re-watch parts that you are not sure about.
The Need for Statistics • Understanding basic statistics is beneficial for everyone
Descriptive Statistics • Histogram (bar graph) – Scale labels
Descriptive Statistics Measures of Central Tendency • • Mean (arithmetic average) Median (middle score) Mode (occurs the most) Skewed distribution
Descriptive Statistics Measures of Variability • Range • Standard Deviation
Standard Deviation
Descriptive Statistics Measures of Variability • Normal Curve (bell shaped)
Descriptive Statistics Measures of Variability • Normal Curve
Inferential Statistics
Inferential Statistics When Is an Observed Difference Reliable? • Inferential statistics • Representative samples are better than biased samples • Less-variable observations are more reliable than those that are more variable • More cases are better than fewer
Inferential Statistics When Is a Difference Significant? • Statistical significance – The averages are reliable – The differences between averages is relatively large – Does imply the importance of the results
Psychology Applied • Can laboratory experiments illuminate everyday life? – The principles, not the research findings, help explain behavior • Does behavior depend on one’s culture and gender? – Culture – Gender
Ethics in Research • Ethics in animal research – Reasons for using animals in research – Safeguards for animal use
Ethics in Research • Ethics in human research – Informed consent – Protect from harm and discomfort – Maintain confidentiality – Debriefing