UNIT 2 POPULATION AND MIGRATION CHOROPLETH MAPPING Using


 • 1/9 of world")


 POSSIBILISM (ACCEPTED THEORY TODAY) • Possibilism – The theory")


 HOW WILL THE CHANGES IN THE COAST AFFECT THE STATES POPULATIONS AND ECONOMY?")

- Slides: 28
UNIT 2: POPULATION AND MIGRATION
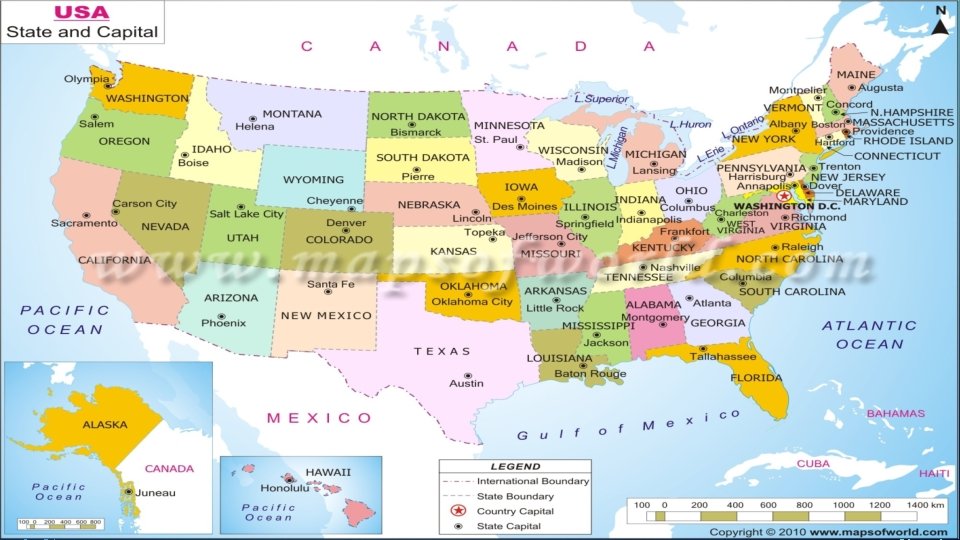
CHOROPLETH MAPPING!! • Using the blank map of the United States you will create a choropleth map showing the most and least desirable states you would like to live in. • You must create 5 classifications for your map and provide a legend. • The scale is 0 -100. 0 means you could not pay me to live there and 100 means oh yeah, I am in! • Make sure the colors and or shades to use are correct with your legend.
CHOROPLETH MAPPING!! • Looking at your map, compare it to the sheet with the populations of the states. Inside each state put the current population. • Is there a pattern between how you rated states and the current populations of those states? ? • What influenced your decision making for this activity?
POPULATION DENSITY • Population density – number of people occupying an area of land. 1. 2. 3. 4. 5. East Asia 6. West Africa South Asia Europe Southeast Asia Northeast North America
HTTPS: //WWW. YOUTUBE. COM/WATCH? V=V CSX 4 YTEFCE
EAST ASIA • Eastern China, Japan, Korean peninsula & Taiwan • ¼ World’s Population • 5/6 live in PRC • China: ½ of population work as farmers (rural) • Japan & Korea • 40% live in 3 major cities (Tokyo, Osaka, & Seoul)
SOUTH ASIA • India, Pakistan, Bangladesh & Sri Lanka • ¼ World Population • ¾ live in India • Most are farmers in rural areas
EUROPE • 3 rd Largest (including European portion of Russia) • 1/9 of world population • ¾ live in cities • < 10% farmers
SOUTHEAST ASIA • Myanmar, Thailand, Laos, Vietnam, Cambodia, Malaysia, Indonesia, Philippines, & Papua New Guinea • Largest = Java = 100 million • Most work as farmers in rural areas
EMERGING POPULATION CONCENTRATIONS EASTERN NORTH AMERICA • NE U. S. & SE Canada • 2% of the world’s population • Most urbanized concentration • >2% farmers WEST AFRICA • West Africa, including south facing coast & Nigeria • 2% of the world’s population • Nigeria = most populous African nation, ½ of this concentration • Most work in agriculture
ECUMENE VS. NON-ECUMENE • The portion of Earth’s surface occupied by permanent human settlement • 80% of earth’s landmass NON-ECUMENE • Areas too harsh for settleme 1. Dry lands 2. Wet lands 3. Cold lands 4. High lands
POPULATION DENSITY 1. 2. 3. Arithmetic Density Physiological Density Agricultural Density
ARITHMETIC DENSITY • The total number of people divided by the total land area • Pros • Easy to compare • Cons • Tells us “where, ” but not “why”
PHYSIOLOGICAL DENSITY • The number of people per unit of area of arable land, which is suitable for agriculture • Pros • More meaningful • Cons • Higher = more pressure to produce more food
AGRICULTURAL DENSITY • The ratio of the number of farmers to the total amount of land suitable for agriculture • LDCs (Less Developed Countries) • • • Higher agricultural density More farmers on less land Less efficient = more farmers on the land. • MDCs (More Developed Countries) • • • Lower agricultural density Fewer farmers, more extensive areas Due to better technology & finances
COMPARISON • What does it mean when we have a large difference between arithmetic & physiological density?
OVERPOPULATION • Carrying capacity - The population level that can be supported, given the quantity of food, habitat, water and other life infrastructure present. • Carrying Capacity is the ability of a resource base to sustain a population • Overpopulation – The number of people in an area exceeds the capacity of the environment to support life at a decent standard of living. • Overpopulation • Too many people compared with the resources of
HUMAN-ENVIRONMENT INTERACTION
HUMAN-ENVIRONMENT INTERACTION • Three schools of thought: • Cultural ecology • Environmental Determinism • Possibilism
CULTURAL ECOLOGY • Cultural ecology – Geographic approach that emphasizes humanenvironment relationships. • Different cultural groups modify the natural landscape in different ways • • Based on regions Based on beliefs • Cultural Ecology is the study of human-environment interaction
THEORIES ENVIRONMENTAL DETERMINISM (DYING THEORY) POSSIBILISM (ACCEPTED THEORY TODAY) • Possibilism – The theory that the physical environment may set limits on human actions, but people have the ability to adjust to the physical environment and choose a course of action from many alternatives.
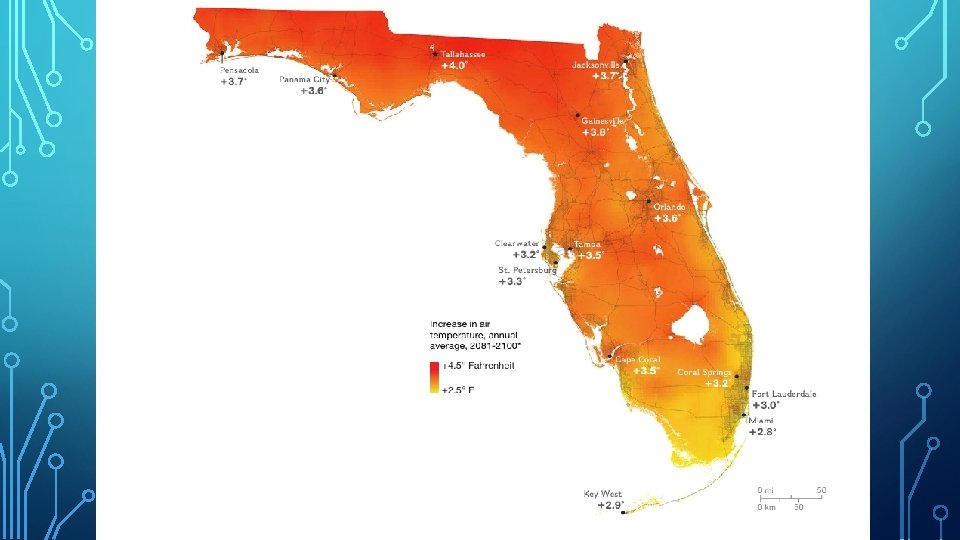
FLORIDA One of the fastest growing states in the United States. -Good Climate -Strong and growing economy with many service industry oriented jobs. This means low skilled labor. -Population is swelling due to migrants from Latin America and wealthy Europeans looking to relocate.
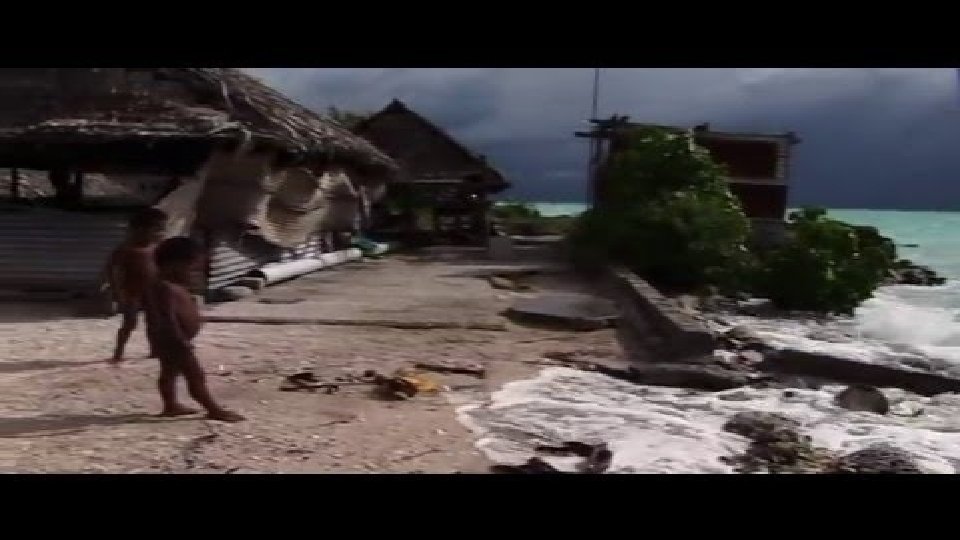
POSSIBILISM: THEORY THAT THE PHYSICAL ENVIRONMENT MAY SET LIMITS ON HUMAN ACTIONS, BUT PEOPLE HAVE THE ABILITY TO ADJUST TO THE PHYSICAL ENVIRONMENT AND CHOOSE A COURSE OF ACTION FROM MANY ALTERNATIVES. IF CLIMATE CHANGE IS REAL AND OCEAN LEVELS ARE EXPECTED TO RISE, IS MIAMI READY? ?
1) HOW WILL THE CHANGES IN THE COAST AFFECT THE STATES POPULATIONS AND ECONOMY? 2) WHY ARE RISING SEAS A BIG PROBLEM FOR MANY LIVING IN MIAMI? 3) HOW COULD RISING SEAS AFFECT OTHER PARTS OF THE WORLD? 4) HOW IS FLORIDA TRYING TO ADAPT TO THE CHANGES IN SEA LEVELS? 5) OPTIMISTIC OR PESSIMISTIC, DESCRIBE THE OUTLOOK OF THE FUTURE FOR PEOPLE LIVING IN FLORIDA.
WHY DOES THIS MATTER? -39% or 123. 3 million Americans live by the coast -40% of the world’s entire population lives in coastal regions!