Unit 2 Demography Population Studies Implications of Population
")


 • Remember, close")


 • • • Calculated how? High =40+ Low = <15")
 • • • Calculated? High = 18 Low = <10")
 or (RNI) • Calculated how? • Ex: CBR")
 • • • Calculated how? High = 2+% Low")

 (ages 15 -49? ? ? ) • • •")
 2006(changed) • to improve the social networking between busy")


 http: //www. msnbc. msn. com/id/20268426/ns/world_news-europe/t/russians-offered-day-prizes-procreate/")

 • local")


 + (65+) divided by working-age population (those")


 • # babies who die before their")


 16. 9 million 16.")


")


- Slides: 137
Unit 2: Demography (Population Studies)
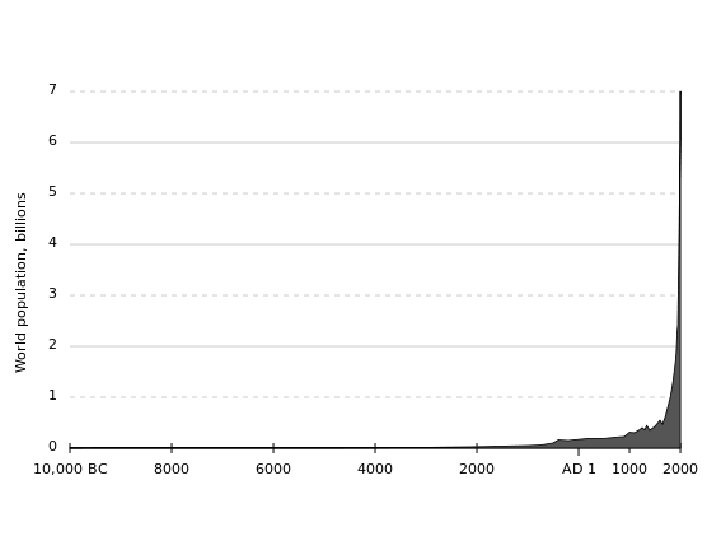
Implications of Population growth Real Time Population Statistics @ http: //www. worldometers. info/ The World at Seven Billion @ http: //www. youtube. com/watch? v=sc 4 Hx. Px. Nr. Z 0 The World’s Most Typical Person @ http: //www. youtube. com/watch? v=4 B 2 x. Ov. KFFz 4 Hans Rosling explains population growth and its implications using legos @ http: //www. youtube. com/watch? v=Sxbpr. Yyjyy. U
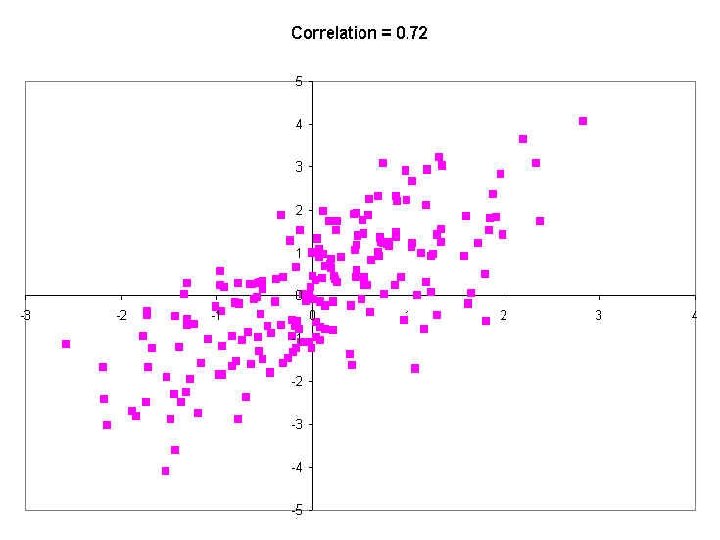
I. Population Statistics • 1 st question: “Where is the data coming from? ” After all, Figures don’t lie, but the liars can figure! • Basic terminology: What does correlation mean? ? ?
Correlation Coefficient • • • Measures how related 2 variables are Shown as #s b/t +1 and -1 Determines: – STRENGTH • Closer to 1/-1 = strong correlation • Closer to 0 = weak/no correlation – DIRECTION (positive or negative) • Determined through statistical magic!
Practice determining Strength… Which is stronger? A. -. 8 or +. 5 B. . 2 or -. 3 C. . 9 or. 1 D. . 5 or -. 52 E. -. 9 or. 9
Let’s look at Scatter Plots (they show the variables being measured) • Remember, close to zero = weak relationship/unrelated variables • Ask yourself: Is it going NE or SE? – NE = “Positive” = both variables increase OR both decrease (“direct relationship”) – SE = “Negative” = One variable increases other decreases (“inverse relationship”) • Correlations do NOT = causation!!!
Scatter Plots
TRUE or FALSE 1. If there seems to be no spatial relationship among the plots than there is a very weak or insignificant relationship among the two variables. 2. If the plots all fall along an imaginary line except for one, then the relationship has to be strong. 3. If all the plots fall along an imaginary line the relationship is 1. 0, or close to 1. 0.
– Slight positive correlation: . 42
• 10 Questions Positive or negative correlation? Strong or weak? A. B. C. D. E. F. G. H. I. • Identical twins’ IQ scores? Age and wealth? Caloric intake to weight? Affluence and family size Geographical knowledge and sexiness? AP Human Geo GPA and score on AP Exam Alcohol Intake and balance/consciousness LOL Sarcasm in answers and Exam Scores? ? Washing hands and likelihood of getting swine flu? Next scatter plot… what correlation coefficient would you expect?
Let’s relate this to something that affects you… • What do colleges look at when you apply? • What is the relationship b/t the almighty GPA and college success (freshman year GPA) • How about the ALMIGHTY SAT score and college success? ? ? • Actual statistics: . 48 and. 42 respectively • What about combined? ONLY. 55!! Surprised? ? ? • Why are freshmen so unpredictable? ?
Variables: Math Score on SAT and GPA in college
Question? If they really have no clue who will succeed and who will not, why use these statistics for admittance into colleges?
Why and how did the College Board change the SAT a few yrs. ago? According to the College Board…Did the changes to the SAT impact its predictive validity? • Our expectations are that the predictive validity of the total test will increase modestly with the addition of writing as a third measure of students' critical thinking skills. In a recent validity study, the SAT Subject Test in Writing was judged to be the best single test in predicting freshman grade point average for all ethnic/racial groups except Asian Americans. In that same study, adding SAT Writing Subject Test scores to SAT scores added. 02 to. 03 incremental validity above SAT and high school grades. Another study, conducted by the University of California, showed the Writing Subject Test added. 06 to. 08 to the overall predictive validity, while the most recent study indicates that it added. 02 for students in most majors except those in education; for those students, the increment rose to about. 06.
No Talking!
Back to Population Statistics…
1. Birth Rate (CBR) • • • Calculated how? High =40+ Low = <15 Wealth and CBR – Positive/negative correlation? – Exceptions: China (12) E. Europe (12)Low wealth and low CBR. Otherwise, high wealth, low CBR. • • • Highest: Chad (51) and Niger (50) Lowest: Germany/Bosnia/Japan @ 8 U. S. : 13 World average = 20 MDCs = 11, Dev = 22, w/o China = 25, LDCs = 34
2. Death Rate (CDR) • • • Calculated? High = 18 Low = <10 Stat can change dramatically – War, pandemic, famine, etc. – W. Hem in 16 th Century was 900/1, 000 • Correlation Wealth and CDR? • • • – NOT Really? Highest: Sierra Leone (18) & E. Europe ~15 Lowest: U. A. E (1) and Qatar & Oman (2) U. S. : 8
3. Natural Rate of Increase (NRI) or (RNI) • Calculated how? • Ex: CBR 20 CDR 5 THEN NIR = 15/1000 = 1. 5% • High = 2 -3% Low = Less than 1% • USA formula CBR 13. 8 minus CDR 8. 4 = 5. 4/1, 000 =. 54% • Europe: Denmark, Finland, Iceland, Ireland, Norway, Sweden, U. K. , Belgium, France, Luxembourg, Netherlands, Switzerland, Albania, Kosovo, Spain have slightly pos, NRI. A number of others have a 0 or negative NRI. Why? Highest in world = Niger.
4. Population growth rates (PGR) • • • Calculated how? High = 2+% Low = <1% or negative U. S. : 13. 8 (CBR) – 8. 4 (CDR) + Net migration 4. 3 (per 1000) = 9. 7/1000 =. 97% • Population Growth trends – Negative/Positive Correlations? • Women’s rights • Economic growth • Literacy rate Impact of immigration?
Notice Some Trends?
5. Total Fertility Rates (TFR) (ages 15 -49? ? ? ) • • • 2. 5 for the world today 8. 1 highest in history 2. 33 stability = “replacement rate” – – 2. 1 in industrialized nations 2. 5+ in peripheral country Why not 2. 0? Mortality rates of women before they can have children • Comparisons: – High: Niger (7. 6), Chad (7. 0), Somalia (6. 8) (a lot of babies!!) – U. S. : 1. 9 – Low: Singapore (1. 3) Taiwan & South Korea (1. 3) • Lower fertility rates: Cause for optimism?
Singapore Social Development Unit 1984(started) 2006(changed) • to improve the social networking between busy working individuals • organize activities for its members http: //www. myspaceanimations. com/myspace-animations-heart-graphics. html
Social Development Unit “Dare to Date" “The Chemistry Guide: When Boy Meets Girl”, '' focusing on the http: //healthscreeningpackagessingapore. com/ overworked, the shy, and the "cosmetically challenged. " The guide reminds hopeful singles that "Skin-care products are must-have investments" and "There's no bigger turnoff than a foul mouth, reeking with leftovers from lunch!" 2 free publications
Population Policies http: //www. monochrom. at/english/2008/04/demographic-winter. htm What types of population policies exist ?
Pro-natalist or Expansive
Anti-natalist or Restrictive http: //www. greenprophet. com/countries/afghanistan /
Maintenance or Stability 2. 1 babies http: //www. yooj. co. uk/test_page_1. html + http: //www. visualphotos. com/image/2 x 4628085/russian_babys_feet_sticking_out_from_blanket
2009 • 36 countries have pro-natalist policies • 67 countries have anti-natalist policies • 33 countries have maintenance policies
*Why would a country want a pro-natalist policy ? • replaces those lost in war and civil unrest • build up the military • replace retiring folks in the workforce • support the increasing number of seniors • occupy parts of a country that are virtually empty • help develop the resources of a state • lead to economic growth • increase majority/minority percentages • gain more influence internationally
Examples: of Pro-natalist Policies Past and Present http: //www. imb. org/southern-africa/images/Malagasy_children. jpg
U. S. S. R. 1944 – 1992 awarded medals to women in order to encourage a high fertility rate. Why ?
3 Categories of Medals were Presented • Motherhood Medals • Order of the Glory of Motherhood or Order of Maternal Glory • Order of Mother Heroine
Motherhood Medals 2 nd Class 5 children 8, 000 awarded 1 st Class 6 children 4, 000 awarded
Order of Maternal Glory 3 rd Class 2 nd Class 1 st Class 7 children - 2, 000 awarded 8 children - 1, 000 awarded 9 children - 500, 000 awarded
Order Mother Heroine 10 children 200, 000 awarded
Germany Cross of Honor of the German Mother http: //nobeliefs. com/mementoes. htm 1938 - 1944
http: //www. diggerhistory. info/pages-medals/nazi 2. htm Bronze 3 rd Class Mother’s Nazi Cross 4, 5 Silver 2 nd Class Mother’s Nazi Cross 6, 7 Gold 1 st Class Mother’s Nazi Cross 8 or more Diamond – 14 or more ?
German Mother’s Cross 14 children ? 17 diamonds http: //snyderstreasures. com/pages/motherscross. htm
Russia Recent incentives 2008 Year of the Family http: //www. farfrommoscow. com/articles/songs-for-russias-day-of-family-fidelity-and-love. html
Russia July 8 • • • Recent incentives new national holiday – Day continued of Family, Love, and Fidelity earlier births stable families – reduce divorce rate, revive family values promote patriotism – babies for Russia A 3 rd child means wealth will be tripled in the third millennium. • “Give me Life Campaign” • http: //somatosphere. net/2011/12/%E 2%80%98 population-prescriptions%E 2%80%99 -pronatalism-and-the-fear-ofunderpopulation-in-post-soviet-russia. html medals for long married couples with children (~ 25 years)
Ulyanovsk Oblast, Russia - Family Contact Day (Conception Day) http: //www. msnbc. msn. com/id/20268426/ns/world_news-europe/t/russians-offered-day-prizes-procreate/ Grand Prize winners of “Give Birth to a Patriot on Russia’s Independence Day” Contest
Japan Princesses Masako & Aiko
Japan Government Incentives • improved parental leave (1 yr. @ 66. 7%) • local govn’ts (rural) cash bonuses • monthly allowance (~ 300/child) • New Angel Plan (more available daycare & less working hours) • free pre-natal care and deliveries http: //factsanddetails. com/japan. php? itemid=600&catid=18 Companies are urged to have family-friendly packages • monthly payments (Matsushita) • shorter hours (Nippon Telegraph & Telephone) • fertility treatments paid for (Canon) • $400 (1 st) - $40, 000 (5 th) (Softbank) • $1000 – 1 st, $2000 – 2 nd, $20, 300 for 3 rd + (Koei Tecmo )
http: //www. chinadaily. com. cn/lifestyle/2006 -05/11/content_586920_2. htm Stop the birth rate decline bra, babies support old people http: //www. chinadaily. com. cn/lifestyle/2006 -05/11/content_586920. htm
Iran Anti-natalist or pro-natalist ? 1967 – first anti-natalist policy W h ? y 1979 – pro-natalist 1988 – anti-natalist 2006 – pro-natalist
1979 http: //www. fnb. to/FNB/Article/Khomeyni/Khomeiny 3. jpg Ayatollah Khomeini • start of Islamic Revolution • family planning program – western influence • promotion of contraception by health officials banned • procreation to bolster the ranks of “soldiers for Islam” (8 year with Iraq)
Khomeini’s pro-natalist policy resulted in GR of 3. 2% Total fertility rate rose to 7
1988
2006 http: //www. msnbc. msn. com/id/38434672/ns/world_news-mideast_n_africa/t/iran-will-pay-new-babies-boost-population/ “I am against saying that two children are enough. Our country has a lot of capacity. It has the capacity for many children to grow in it. It even has the capacity for 120 million people. Westerners have got problems. Because their population growth is negative, they are worried and fear that if our population increases, we will triumph over them. ” Iranian President Mahmoud Ahmadinejad
http: //www. zazzle. com/antinatalism
Why would a country want an anti-natalist policy ? • cannot afford to provide for them • overpopulation concerns - limited available resources local, national, international SCALE • allow more women in the workforce and boost economy • repress a group of people separate policy for certain groups or different applications of the policy (see 2 nd last slide)
China 2 different programs in recent years • Later, Longer, Fewer Policy 1971 • One Child Policy 1979
What difference would it make when you got married ? http: //www. photoshopessentials. com/photo-effects/photo-templates/ http: //www. world-of-weddings. com/wedding-dresses/older-bride-wedding-dress. html
One Child Policy 1979 - rewards start once 1 child contract is signed Rewards • free medical care • free daycare and schooling • guaranteed job for child • bonuses for parents • extra maternity leave • better housing • bigger old age pension Penalties • must repay financial benefits • educational, medical benefits, & guaranteed jobs are withdrawn • parents’ wages reduced
*How did the government persuade its citizens to cooperate ?
80, 000 Family Planning Workers http: //www. iisg. nl/~landsberger/pop 1. html
Education Program http: //www. nisjapan. minidns. net/nis/galleries/5 thgradestudentwork/5 th. Grade. China. Project/07 CN. html
Peer pressure
Advertizing http: //www. iisg. nl/~landsberger/pop 1. html
http: //www. iisg. nl/~landsberger/pop. html Carry out family planning Implement the basic national policy
Clever and pretty healthy and lovely source: http: //www. iisg. nl/~landsberger/pop. html
http: //www. iisg. nl/~landsberger/pop 1. html http: //www. iisg. nl/~landsberger/pop. html
Little emperors Any social problems ?
In recent years China has relaxed the rules, and in some cases have even started encouraging two children. (in some districts in certain situations) Why ? In many cases, parents are not taking advantage of this opportunity. *Why ?
Only countries with over 5 million people
6. Doubling Time • • • Def. ? Assumption? ? Constant PGR World’s doubling time is 64 years – As TFR increases, doubling time ______. – At 1% growth rate it takes 70 years to double – At 2% growth rate takes 35 years to double • • • U. S. = 70/. 9% = 78 What is Eastern Europe’s doubling time? Japan’s? ?
7. Dependency ratio • Calculated: (Pop. <15) + (65+) divided by working-age population (those aged 15 -64) • Dependency ratio tells us how strained working pop. is – Ex. Dependency ratio of 0. 9 means there are 9 dependants for every 10 working-age people • Keep in mind: – Negative correlation b/t dependency ratio and the ability to take care of dependents
Issues with Dep. Ratio • Future for the U. S. ? Soc. Security? • Better to have too many old, too many young? • Impact of Underemployment? Unemployment? • Child Labor?
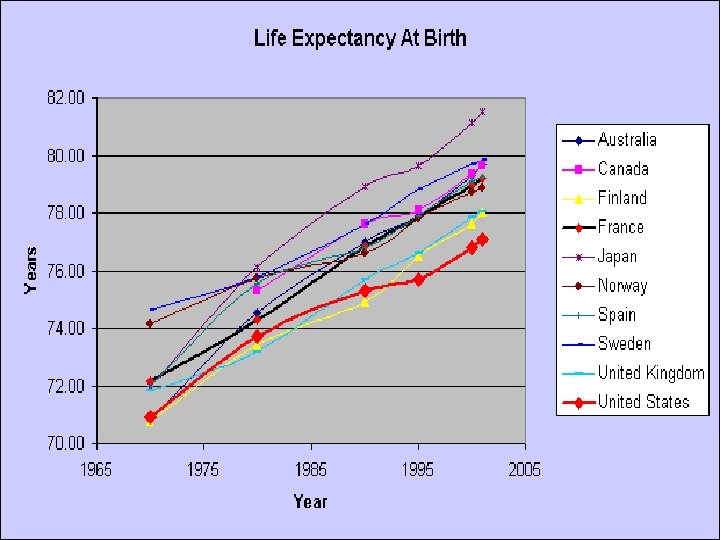
8. Life Expectancy # years expected to live for babies born this year
What do you predict your life expectancy to be? • http: //gosset. wharton. upenn. edu/mortality/perl/Cal c. Form. html • Almost 2. 5 million Americans died last year – – 650, 000 heart disease 550, 000 cancer 150, 000 stroke 73, 000 diabetes • Comparisons: – High: Japan (83, females 86) Singapore (81. 98, females 84) – U. S. : 79, females 81. Low: Botswana (47) Lesotho (48) – World avg. (70)
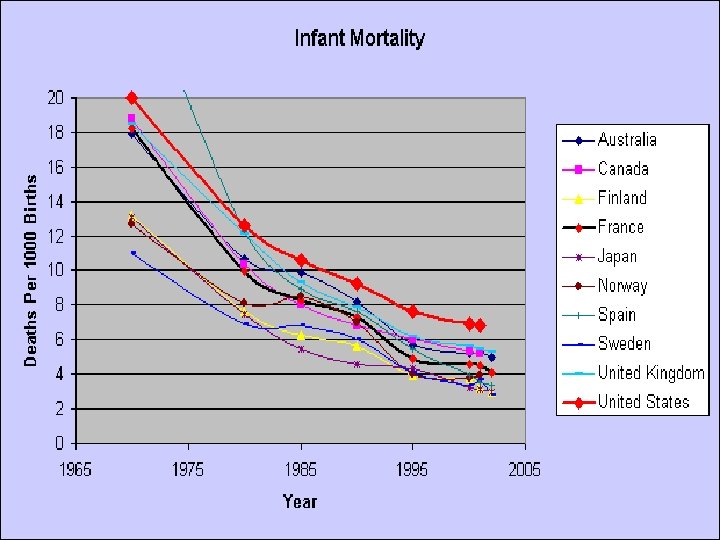
9. Infant Mortality Rates (very tragic stuff) • # babies who die before their 1 st birthday out of 1, 000 live births • Not included: abortions or miscarriages • Contrast MDC v. LDC • Correlation w/ wealth? • Comparisons: – High: Sierra Leone (128) C. A. R. (116) D. R. C (111) Afghanistan (was 157, now 71) Pakistan (74) – – – Low: Japan (2. 2) Sweden (2. 76) Singapore (1. 8) U. S. : 5. 9 World: 40. MDCs =5, Dev = 44 w/o China = 48, LDCs = 66
10 Highest 2007 est. cia. gov Angola 184. 44 Sierra Leone 158. 27 Afghanistan 157. 43 Liberia 149. 73 Niger 116. 83 Somalia 113. 08 Mozambique 109. 93 Mali 105. 65 Guinea-Bissau 103. 50 Chad 102. 07 2007 est.
IMR cont. • List 5 variables negatively correlated w/ IMR • List 5 variables positively correlated w/ IMR • Practice w/ demographics: http: //www. pbs. org/wgbh/nova/worldbalance/dem ographer. html
Demographic Transition Model: Basics of DTM explained @ http: //www. youtube. com/watch? v=d 1 d. IAtv. SFLM One reason this class is so stimulating is our focus on Models
Stage One = “High stationary” What is happening with CBR and CDR?
Causes of Stage One • • Lack of clean water diseases spread Inefficient sewage diseases spread Food shortages famine Death rates fluctuate wildly – Wars – Diseases – Drought – Natural disasters
Stage Two = “Early Expansion”
Stage Two = Decline in death rates: WHY? Setting: Europe and N. America (1800 s) 1. Improvements in water supply, sewage, food handling 2. General personal hygiene (baths are now cool) 3. Increased female literacy 4. 2 nd Agric. Revolution = MORE FOOD! – Higher yields by farmers agricultural practices were improved – Mechanization of farming – New system of crop rotation • Leads to increase survival of the children • LDCs (1950 s) medical technology revolution
Stage Three = “Late Expanding” • Declines in birth rate WHY? – Drop in IMR – Urban life too expensive/not enough space – Gains for women • • Increase in literacy rate More access to education – Postponing marriage – (Contraceptives were not widely available in the first half 20 th) • MDCs moved into Stage 3 during early 20 th • If LDCs are in Stage 3, they did so in the last 20 years
Why CDR fall b 4 CBR? ? ? • Easier to convince people to stop dying than to stop “being longitudinal”
Stage Four = Low Stationary
Stage 4: “Low Stationary” • Careers for women CBR = CDR – postpones marriage/childbirth – Rise of daycare more expensive • Wide access to birth control methods • DINKs MUCH more common lifestyle choice – Travel not conducive to raising a family – More freedom for people to enjoy life – NO KIDS TO MAKE THEM INSANE!! • What begins to happen at the very end of stage four? • Stage 5? ? ? – CDR exceeds CBR over many years – Not yet part of the DTM but much discussed and supported – Eastern European countries • Low birth rates • Aging population • Bleak future pollution, political instability, low economic growth rates, etc.
Demographic Transition Model • Can a country skip stages? • Can a country move backwards? • Have all countries gone through this process? Can all countries go though this process?
The Demographic Divide: Niger and Netherlands Niger Netherlands Population (2013) 16. 9 million 16. 8 million Projected Population (2050) 65. 8 million 17. 9 million 2050 Projected Population as a Multiple of 2013 3. 9 1. 1 Lifetime Births per Woman 7. 6 1. 7 845, 000 195, 000 176, 000 141, 000 50% 17% % of Population Ages 65+ (2013) 3% 16% % of Population Ages 65+ (projected 2050) 3% 27% 57 years 81 years 51 3. 7 43, 000 650 Annual Births Annual Deaths % of Population Below Age 15 Life Expectancy at Birth (all) Infant Mortality Rate (per 1, 000 live births) Annual Number of Infant Deaths
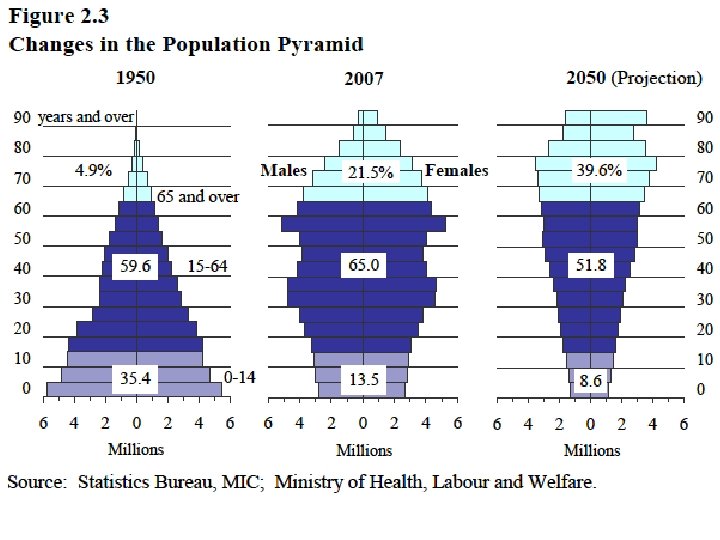
Population Pyramids and the DTM • You may be asked to determine which stage a country is in based on a pop. pyr. • Pyramid advice – how to analyze a pyramid: – Look at 4 things: • Top of the pyramid • Bottom of the pyramid • Any bulges/indentations in the pyramid? • The symmetry of the pyramid https: //www. youtube. com/watch? v=s. So. SYm 4 AOls – Always refer to SPECIFIC POINTS on the pyramid!!! – Make sure to look at pyramids at different scales! – Think about what stage of the DTM the pyramid reflects
Population Pyramids What patterns do you see? Rwanda France Mexico U. S. Russia China India UAE
FRQ Strategy • College Board always has at least one definition style FRQ and you have practiced it many times. • Occasionally, they will have you analyze a map/pyramid/chart/data set…. While applying a sexy concept. • For example… • Impossible to predict what they will throw at you BUT always make sure you refer to specific points on the diagram, chart, etc. while explaining your answer. • Let’s practice…
Do you see some trends?
Do not write like this: “The map clearly shows that Japan’s population has steadily grown older and is in stage four of the demographic transition. ” Instead, use your head, write like this instead… “The map clearly shows that Japan’s population has steadily grown older; for instance, the chart shows that only about 7% of Japan’s population was over 65 in the 1970’s but that percent has more than doubled to over 18% in about 2003. This is evidence of being in stage four of the demographic transition. ”
What does it mean to be overpopulated?
What’s unique about the population of: Java, Nigeria, Gaza Strip and Uganda, Ukraine, Japan, China, Ireland, Egypt & Canada?
Where Is This? ?
II. Population Theories • Thomas Malthus published his essay in 1798 Malthus’ three assumptions (This was before the Industrial Revolution) – – – • food grows _____ pop grows _____ Britain was a closed sys. = People will eventually run out of food
Malthus had five siblings, but he only had three children • I think I may fairly make two postulata. First, That food is necessary to the existence of man. Secondly, That the passion between the sexes is necessary and will remain nearly in its present state. These two laws, ever since we have had any knowledge of mankind, appear to have been fixed laws of our nature, and, as we have not hitherto seen any alteration in them, we have no right to conclude that they will ever cease to be what they now are, without an immediate act of power in that Being who first arranged the system of the universe, and for the advantage of his creatures, still executes, according to fixed laws, all its various operations. . Assuming then my postulata as granted, I say, that the power of population is indefinitely greater than the power in the earth to produce subsistence for man. Population, when unchecked, increases in a geometrical ratio. – Malthus 1798
Malthus cont. • Solutions to the problem? – Moral restraint, but only for the poor! – “Preventative checks” = lower birth rates • • marrying later Abstinence Birth control (He didn’t anticipate this) Homosexuality – Positive checks = increase death rates • • War Disease Natural Disaster Famine
Poor Ben and Poor Esther “Observations Concerning the Increase of Mankind. ” • Disagreed with Malthus: – Wealth restrains growth not morality – Food production stays ahead of population growth
Poor Esther • The Conditions of Agricultural Growth: The Economics of Agrarian Change under Population Pressure • Population density creates more agricultural output the number of people dictates the type of agriculture practiced – Humans are smart – They will figure out ways of producing more food on the same amount of land rather than starve to death!
Neo Malthusian Geeks = is Earth a closed system? • There is a limit on population; it’s just higher than Malthus estimated • Gap b/t resources and population in some countries is wider than Malthus assumed • LDCs are getting relatively poorer and less access to resources • Population growth is depleting ALL resources NOT just food production – Wars and violence will occur b/t peoples competing for resources – Earth won’t sustain pollution or huge population numbers
III. Population concentrations • • >Along coastlines >Northern hemisphere >Eurasia <Less concentrated where?
Climates’ “carrying capacity” • 1. 2. 3. 4. • The amount of life a particular place can sustain H. Subtropical (USA, China, Japan, Australia) H. continental (USA, China, Japan, Europe) Mediterranean Wet and Dry trop (India) Lowest carrying capacities: (USA, Europe) – Arid – Polar/Sub-Polar
IV. Population Movements Push and Pull factors of migration Push = Pull = What is a refugee? – International vs. internal (intranational) – Difficult to define: • What is a “well-founded fear of reprisal? ” • Migration because of fear or economic opportunity? International Migration: http: //www. youtube. com/watch? v=l. OZmq. Iwqur 4 (7: 38)
Our text says there are 3 types of Push & Pull factors Political Economic Environmental • Net migration – Immigrants – emigrants (# out of 1000) – Net in-migration – Net out-migration
Major movements in the 20 th 1. East Asia, India, and Latin America (Mexico) TO the U. S. late 20 th. (South/East. Europeans U. S. early 20 th) 2. Russians TO other Warsaw Pact countries during Cold War 3. Kosovars TO surrounding countries during ethnic cleansing of Serbia 4. White South Africans TO United States and Western Europe in post-apartheid S. Africa 5. Americans from Rustbelt TO Sunbelt 6. Rwandans from Rwanda TO surrounding countries
7. Cuban refugees during Castro’s coup • 15 Cubans Who Got to Fla. Bridge Sent Home • MIAMI Fifteen Cubans who fled their homelanded on an abandoned bridge piling in the Florida Keys were returned to their homeland Monday after U. S. officials concluded that the structure did not constitute dry land. Under the U. S. government's "wet-foot, dryfoot" policy, Cubans who reach dry land in the United States are usually allowed to remain in this country, while those caught at sea are sent back.
More Migrations… 8. Vietnam's "boat people“ http: //www. boatpeople. org/ Read “A TRUE STORY” and “Boat People” 9. Jews from homes in U. S. S. R. to Israel and the U. S. in the 1990 s 10. Muslims in India to Pakistan and Bangladesh after the partition of India 11. Refugees from Sudan pouring into Ethiopia, Chad, and Kenya 12. Eastern Europeans and Muslims from their homes TO Western Europe 13. Workers in western China migrating TO Eastern China and major Pacific Rim cities http: //www. youtube. com/watch? v=KNXg-k. Yk-LU 14. African Americans from South to North after Civil War 15. Ugandans from Uganda to neighboring African countries
15. Uganda – Idi Amin Estimates of between 300, 000 – 12 million killed by him
Remade in America NY Times interactive on Global Migration: What patterns do you see? What are the causes, effects? http: //www. nytimes. com/interactive/2009/03/10/us/2009031 0 -immigration-explorer. html Please complete the associated activity
V. The Gravity Model Used to predict the interaction between any two hamlet/village/town/city/megalopolis (Population city A)(Population city B) Distance squared Why is the distance in the denominator squared?
How is the coefficient found? • It is defined as the sum of the products of the standard scores of the two measures divided by the degrees of freedom: • Note that this formula is very simple
It’s magic! It is not necessary for you to know how these correlation coefficients are created! Just know it is really GEO!
1 st Swine Flu Victim? ? ?
Review FRQ Advice: When analyzing charts, make specific references about specific data on the chart/graph… Do not make generalizations without making specific references to data on the chart.
For example, say “the cohort of females who are 0 -4 years old are #? more than in cohort 5 -9 which indicates that the population is growing each year.
What % of men are 0 -4 compared with women? 85 plus?
In life and academia: When a concept’s definition is really short and concise it is NOT ______ CONVERSELY When a concept’s definition is really long and complex it is ______
What would a strong negative relationship look like? Draw one on your piece of paper with fifteen plots
What is the difference between population growth and population change?
Population Change can be more than just total # of people • Gender • Religion • Ethnicity
Based upon this map, what areas are under-populated?
In some areas of Europe there are comparatively dense populations found in mountainous, rugged country because of proximity to coal fields.