
Unit 1 Lesson 16 Categorical Associations Rosa has
- Slides: 12
Unit 1 Lesson 16: Categorical Associations
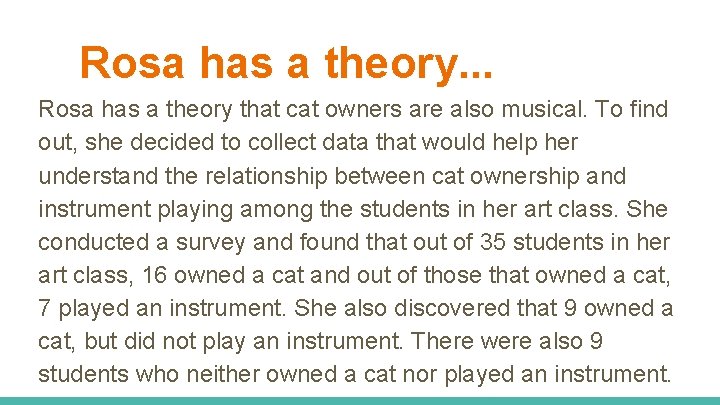
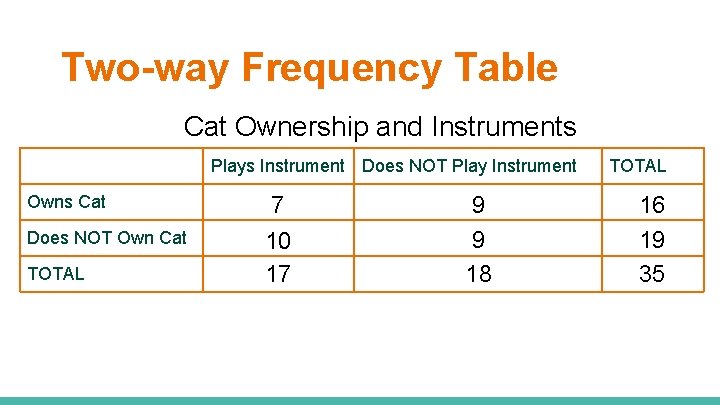
Rosa has a theory. . . Rosa has a theory that cat owners are also musical. To find out, she decided to collect data that would help her understand the relationship between cat ownership and instrument playing among the students in her art class. She conducted a survey and found that out of 35 students in her art class, 16 owned a cat and out of those that owned a cat, 7 played an instrument. She also discovered that 9 owned a cat, but did not play an instrument. There were also 9 students who neither owned a cat nor played an instrument.
1. Ask (Statistical) Questions ● What is Rosa trying to find out? ○ What could be a possible statistical question for this?
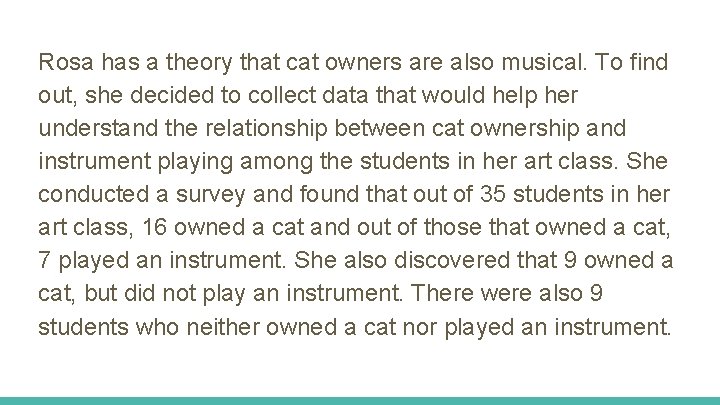
Rosa has a theory that cat owners are also musical. To find out, she decided to collect data that would help her understand the relationship between cat ownership and instrument playing among the students in her art class. She conducted a survey and found that out of 35 students in her art class, 16 owned a cat and out of those that owned a cat, 7 played an instrument. She also discovered that 9 owned a cat, but did not play an instrument. There were also 9 students who neither owned a cat nor played an instrument.
2. Consider Data ● What variables did Rosa collect? ● What 2 questions did she ask to get this information? Do you play an instrument? Do you own a cat?
Rosa has a theory that cat owners are also musical. To find out, she decided to collect data that would help her understand the relationship between cat ownership and instrument playing among the students in her art class. She conducted a survey and found that out of 35 students in her art class, 16 owned a cat and out of those that owned a cat, 7 played an instrument. She also discovered that 9 owned a cat, but did not play an instrument. There were also 9 students who neither owned a cat nor played an instrument.
3. Analyze Data ● What were the values of the variables identified previously? ● How can we summarize Rosa’s findings (what type of visualization)? How about a: Two-way Frequency Table!
Rosa has a theory that cat owners are also musical. To find out, she decided to collect data that would help her understand the relationship between cat ownership and instrument playing among the students in her art class. She conducted a survey and found that out of 35 students in her art class, 16 owned a cat and out of those that owned a cat, 7 played an instrument. She also discovered that 9 owned a cat, but did not play an instrument. There were also 9 students who neither owned a cat nor played an instrument.
Two-way Frequency Table Cat Ownership and Instruments Plays Instrument Does NOT Play Instrument Owns Cat Does NOT Own Cat TOTAL 7 10 17 9 9 18 TOTAL 16 19 35
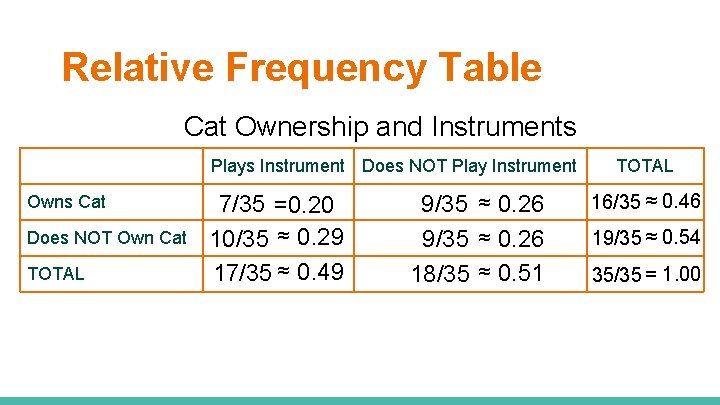
Relative Frequency Table Cat Ownership and Instruments Plays Instrument Does NOT Play Instrument Owns Cat Does NOT Own Cat TOTAL 7/35 =0. 20 10/35 ≈ 0. 29 17/35 ≈ 0. 49 9/35 ≈ 0. 26 18/35 ≈ 0. 51 TOTAL 16/35 ≈ 0. 46 19/35 ≈ 0. 54 35/35 = 1. 00
Two-Way Frequency Table vs Relative Frequency ● Similarities? Table ● Differences?
4. Interpret Data ● Using the frequency tables, answer: ○ What proportion of students did not play an instrument and did not own a cat?